Model Talk
Off-season model tweaks (2026)
PUBLISHED — 2026-02-18
There were two meaningful changes to our model setup this offseason. First, we added some complexity
to how we project players' standard deviations, which are used in our simulations. Second, we are now using shot-level data
to account for differences in the predictive power of individual shots.
Standard deviations
Previously, our standard deviation modelling consisted of starting with a baseline SD for each tour
and adjusting away from that using player-specific SDs for golfers with sufficient data. For low-data players,
SDs were estimated using data from golfers at a similar point in their career (e.g. rookies on the PGA Tour). We then
made additional adjustments to account for course-specific differences in variance.
Late last year I was investigating something and I noticed that we appeared to be overestimating the standard deviations of high-skilled players. It turns out—which is pretty obvious in hindsight—that SD varies with skill. The table below shows the standard deviation in residual (actual minus predicted) strokes-gained on the PGA Tour for various skill groups:
For the skill range that matters most for predicting PGA Tour tournaments (> -0.5), there isn't that much variation in SD, but even a 0.1 stroke difference in a player's standard deviation can materially affect win probabilities.
The other variable we now account for when projecting standard deviations is driving distance. Longer hitters tend to have higher variance in scores, all else equal. We also looked at whether driving accuracy had meaningful predictive power for SD and found that it did not.
Our updated SD projection process looks like this: based on a player's skill, driving distance, and the tour we are modelling, we estimate a baseline SD. This is then combined with the player's observed SD over their last 150 rounds (if they have sufficient data) to produce a final projected SD. (This can then be further adjusted based on the course, as before.)
Here are the five smallest projected SDs among players with a skill of at least 0:
A player's actual standard deviation in their recent residual scores only has a modest impact on their projected SD, so the primary driver of appearing on this list is are skill and driving distance. Here are the 5 highest projected SDs:
Late last year I was investigating something and I noticed that we appeared to be overestimating the standard deviations of high-skilled players. It turns out—which is pretty obvious in hindsight—that SD varies with skill. The table below shows the standard deviation in residual (actual minus predicted) strokes-gained on the PGA Tour for various skill groups:
| skill | standard deviation |
|---|---|
| >+0.8 | 2.72 |
| +0.4 – +0.8 | 2.73 |
| 0 – +0.4 | 2.75 |
| -0.4 – 0 | 2.78 |
| -0.8 – -0.4 | 2.82 |
| -1.2 – -0.8 | 2.86 |
| -1.6 – -1.2 | 2.90 |
| -2 – -1.6 | 2.98 |
| -2.4 – -2 | 3.04 |
| -2.8 – -2.4 | 3.12 |
| -3.2 – -2.8 | 3.23 |
For the skill range that matters most for predicting PGA Tour tournaments (> -0.5), there isn't that much variation in SD, but even a 0.1 stroke difference in a player's standard deviation can materially affect win probabilities.
The other variable we now account for when projecting standard deviations is driving distance. Longer hitters tend to have higher variance in scores, all else equal. We also looked at whether driving accuracy had meaningful predictive power for SD and found that it did not.
Our updated SD projection process looks like this: based on a player's skill, driving distance, and the tour we are modelling, we estimate a baseline SD. This is then combined with the player's observed SD over their last 150 rounds (if they have sufficient data) to produce a final projected SD. (This can then be further adjusted based on the course, as before.)
Here are the five smallest projected SDs among players with a skill of at least 0:
| name | dd | actual SD (last 150 rounds) | predicted SD |
|---|---|---|---|
| Aaron Rai | -11.5 yards | 2.34 strokes | 2.61 strokes |
| Christiaan Bezuidenhout | -12.2 | 2.56 | 2.63 |
| John Parry | -3.5 | 2.27 | 2.64 |
| Patrick Reed | -3.1 | 2.34 | 2.65 |
| Abraham Ancer | -8.7 | 2.51 | 2.68 |
A player's actual standard deviation in their recent residual scores only has a modest impact on their projected SD, so the primary driver of appearing on this list is are skill and driving distance. Here are the 5 highest projected SDs:
| name | dd | actual SD | predicted SD |
|---|---|---|---|
| DeChambeau, Bryson | +22.6 | 2.89 | 2.87 |
| Niemann, Joaquin | +15.5 | 2.83 | 2.86 |
| Gotterup, Chris | +16.9 | 2.91 | 2.83 |
| Knapp, Jake | +12.9 | 3.01 | 2.83 |
| Higgo, Garrick | +8.6 | 3.1 | 2.82 |
Shot-level adjustments
The basic idea here can be illustrated with an example.
Consider two players, A and B, who both gain 2 strokes on their approach shots over 18 holes.
Player A gains no strokes for 16 holes but then hits their final two approach shots to within inches of the hole, each
gaining a full stroke. Player B gains their strokes in a more balanced fashion, hitting
7 approach shots that gain between 0.2 and 0.4 strokes.
Analyzing at the round-level would treat these performances the same,
but most people would agree that Player B's performance contains more evidence of underlying skill than Player A's.
The goal of the shot-level adjustments described below is to account for the difference between
performances like these when estimating skill levels.
Something I've mentioned a few times in other blog posts is that the expected strokes to hole out becomes non-linear as the distance to the pin approaches zero. For example, the average pro might be expected to take 1.8 putts to hole out from 15 feet, 1.6 putts from 10 feet, but just 1.2 strokes from 5 feet. If we think the skill difference between hitting an approach shot to 15 feet versus 10 feet is roughly comparable to the difference between 10 feet and 5 feet, this means that strokes-gained will reward the 5-foot shot more than it should (if the goal is predicting future performance). The extreme case is holing out from a reasonable distance: the difference in skill between a holed shot and one that finishes inches away is negligible, but SG treats the holed shot as a full stroke better. The general idea, then, is that when estimating skill from shot-level data, there should be diminishing marginal returns to SG on an individual shot.
We estimate the degree of diminishing marginal returns to strokes-gained for each SG category, modelling positive and negative shots separately. We find that for negative-SG shots it's fine to treat all SG values equally (ignoring penalty strokes, which I'll touch on in a moment). In other words, losing 1 stroke on a single shot appears roughly equivalent to losing 0.5 strokes on two shots. For positive-SG shots in the APP, ARG, and PUTT categories, the predictive power declines as the SG value of an individual shot increases, while for OTT there is no such decline. This is consistent with the intuition described above, where the non-linearity in SG for shots hit close to the pin is the key driver. This effect—diminishing returns to SG— is largest for approach shots, followed by putts, and then around-the-green shots.
We also estimate the predictive power of penalty strokes, and find that a penalty stroke is worth about half of a regular stroke. Therefore, with these adjustments, players who incur penalty strokes receive a boost to their projected skill. This is similar to the non-linearity story above: on a hole with OB right, SG penalizes a tee shot slightly more as it drifts right, and then applies a large negative drop once it cross the OB line. This drop contains some predictive signal (good players avoid hazards), but it also includes a meaningful amount of noise.
As I'm writing this during the 2026 AT&T Pebble Beach Pro-Am, here are the five largest negative adjustments we made to players' total SG in Round 1:
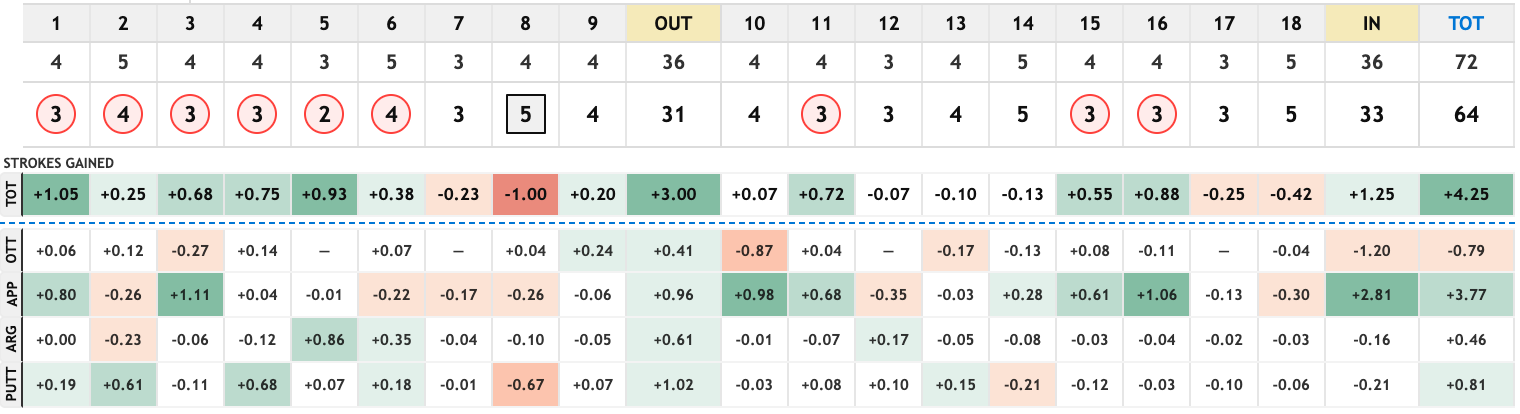
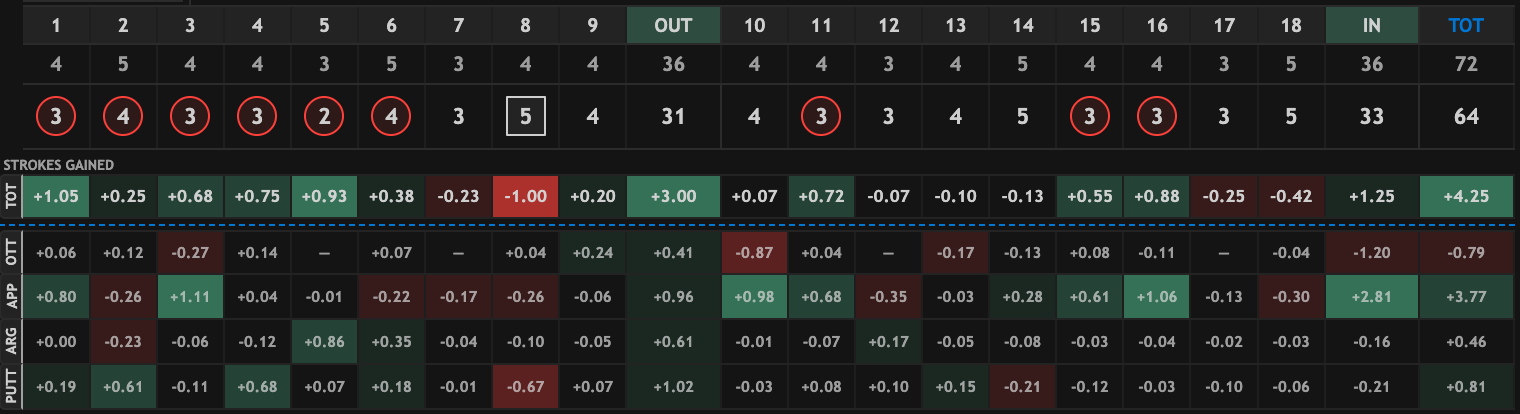
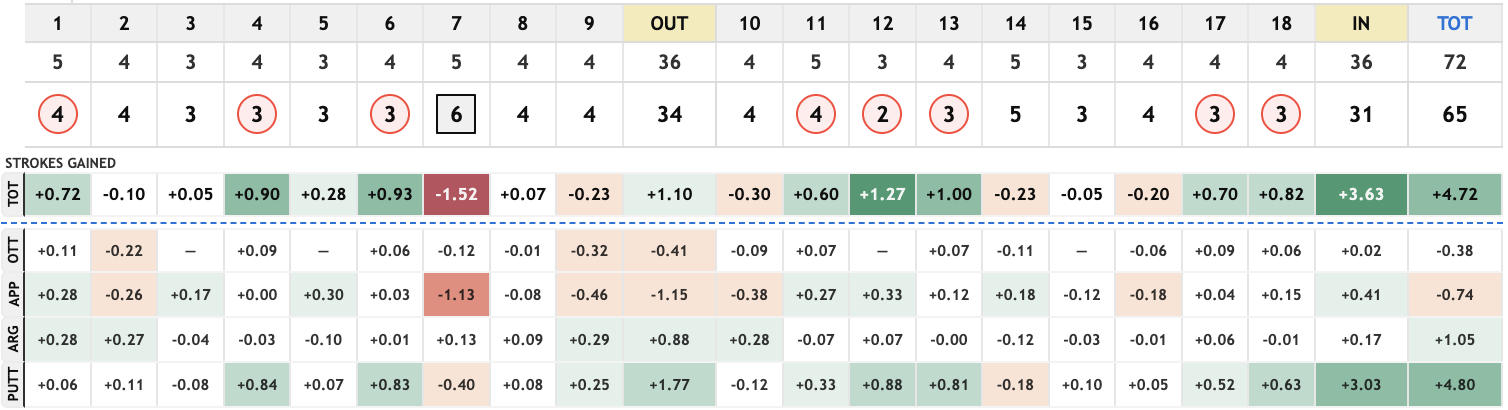
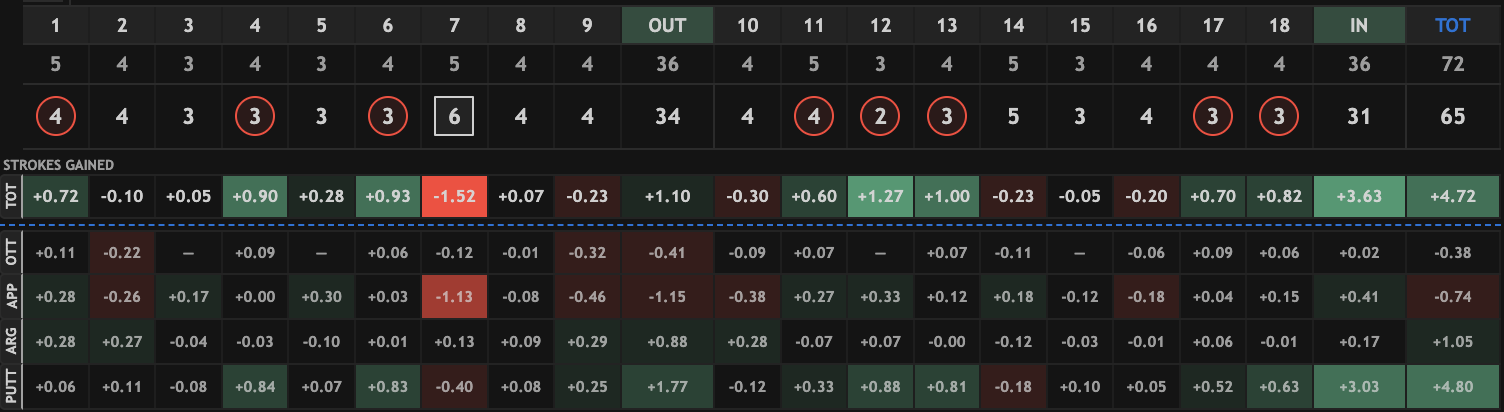
None of these players incurred penalty strokes off the tee, so they each received a small negative OTT adjustment (these are made to be mean-zero by course, which is why there are two distinct values in the table). Gotterup's approach performance in Round 1 is a good example of what this adjustment captures. He had the best approach number of the day (+3.77), but this included three shots that gained a full stroke along with a few other high-gaining shots:
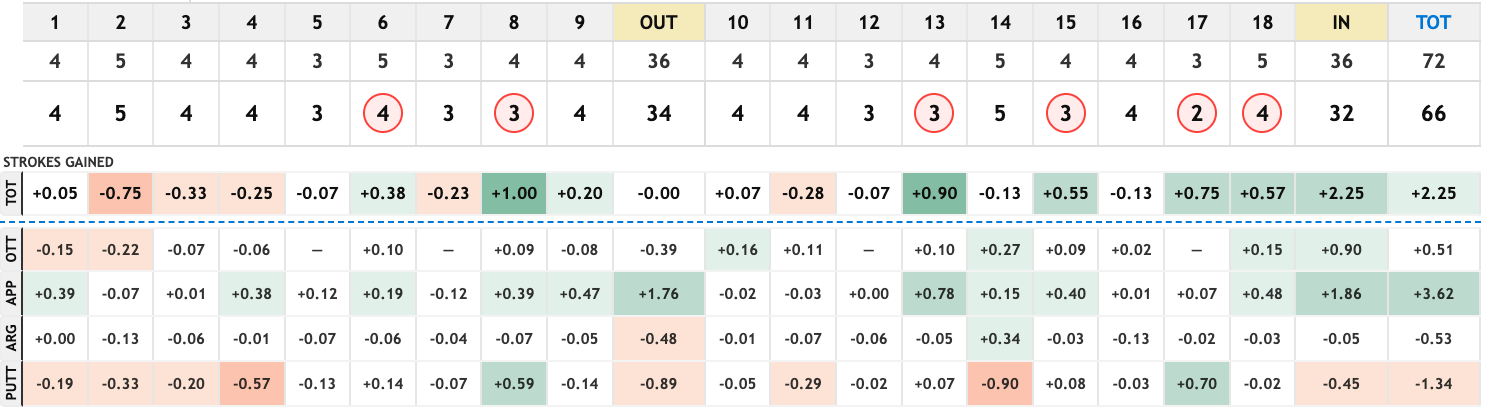
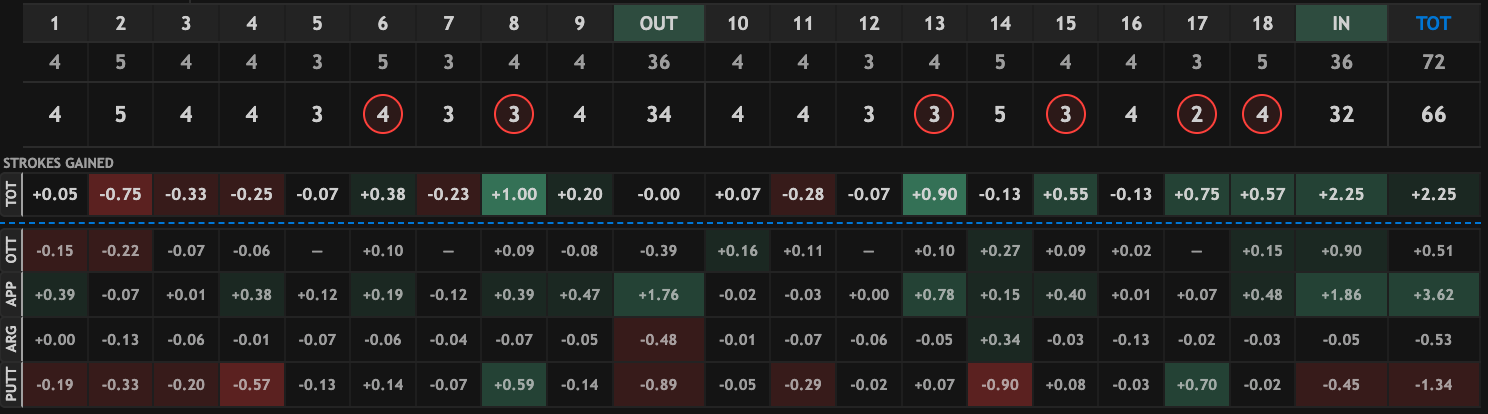
Contrast this with Sepp Straka's first-round performance, where he gained 3.6 strokes on approach but did it with only one shot gaining more than 0.5. After adjustments, we had Straka's approach number as 1.7 strokes better than Gotterup's.
In our live model, performing 1 stroke better on SG:Approach in Round 1 is worth about 0.06 strokes when projecting Round 2. So Gotterup's -1.6 stroke adjustment to his Round 1 approach SG decreases his Round 2 skill by 0.1 strokes. That's meaningful!
Here are the five largest positive adjustments from Round 1 at the 2026 AT&T:
Nick Taylor had the largest positive adjustment to his approach data because he hit a lot of good-but-not-great approach shots (gaining 0.1-0.3 strokes each) and also had a penalty stroke on 7.
The same logic for approach applies to around-the-green shots and putts. Because these shots are shorter, the returns to SG decrease at a slower rate—hitting it to 3 feet from just off the green involves much less luck than hitting it to 3 feet from 200 yards. Across all rounds, the standard deviation of our APP adjustments is 0.41 strokes, for ARG the standard deviation is 0.19 strokes, and for PUTT it is 0.3 strokes.
For our pre-tournament predictions, we estimate these adjustments for every PGA Tour Shotlink-enabled round in a player's history. In theory, because these adjustments are capturing some element of "luck", a player's average adjustment should converge to zero over a large enough sample. However, under the weighting schemes we used to form our SG averages, the average adjustments remain meaningful: last week they ranged from -0.19 to +0.11 for the field competing at Pebble. We are currently tacking this on to the "SG CATS" column on the player decomposition page, but might reorganize that in the near future.
Something I've mentioned a few times in other blog posts is that the expected strokes to hole out becomes non-linear as the distance to the pin approaches zero. For example, the average pro might be expected to take 1.8 putts to hole out from 15 feet, 1.6 putts from 10 feet, but just 1.2 strokes from 5 feet. If we think the skill difference between hitting an approach shot to 15 feet versus 10 feet is roughly comparable to the difference between 10 feet and 5 feet, this means that strokes-gained will reward the 5-foot shot more than it should (if the goal is predicting future performance). The extreme case is holing out from a reasonable distance: the difference in skill between a holed shot and one that finishes inches away is negligible, but SG treats the holed shot as a full stroke better. The general idea, then, is that when estimating skill from shot-level data, there should be diminishing marginal returns to SG on an individual shot.
We estimate the degree of diminishing marginal returns to strokes-gained for each SG category, modelling positive and negative shots separately. We find that for negative-SG shots it's fine to treat all SG values equally (ignoring penalty strokes, which I'll touch on in a moment). In other words, losing 1 stroke on a single shot appears roughly equivalent to losing 0.5 strokes on two shots. For positive-SG shots in the APP, ARG, and PUTT categories, the predictive power declines as the SG value of an individual shot increases, while for OTT there is no such decline. This is consistent with the intuition described above, where the non-linearity in SG for shots hit close to the pin is the key driver. This effect—diminishing returns to SG— is largest for approach shots, followed by putts, and then around-the-green shots.
We also estimate the predictive power of penalty strokes, and find that a penalty stroke is worth about half of a regular stroke. Therefore, with these adjustments, players who incur penalty strokes receive a boost to their projected skill. This is similar to the non-linearity story above: on a hole with OB right, SG penalizes a tee shot slightly more as it drifts right, and then applies a large negative drop once it cross the OB line. This drop contains some predictive signal (good players avoid hazards), but it also includes a meaningful amount of noise.
As I'm writing this during the 2026 AT&T Pebble Beach Pro-Am, here are the five largest negative adjustments we made to players' total SG in Round 1:
| player | OTT | APP | ARG | PUTT | Total |
|---|---|---|---|---|---|
| Chris Gotterup | -0.04 | -1.58 | -0.14 | +0.45 | -1.31 |
| Rodgers, Patrick | -0.01 | +0.02 | -1.17 | -0.01 | -1.18 |
| Bradley, Keegan | -0.01 | -0.30 | -0.72 | +0.0 | -1.03 |
| Burns, Sam | -0.04 | +0.27 | -0.49 | -0.75 | -1.01 |
| Lowry, Shane | -0.04 | -1.18 | +0.06 | +0.29 | -0.88 |
None of these players incurred penalty strokes off the tee, so they each received a small negative OTT adjustment (these are made to be mean-zero by course, which is why there are two distinct values in the table). Gotterup's approach performance in Round 1 is a good example of what this adjustment captures. He had the best approach number of the day (+3.77), but this included three shots that gained a full stroke along with a few other high-gaining shots:
Contrast this with Sepp Straka's first-round performance, where he gained 3.6 strokes on approach but did it with only one shot gaining more than 0.5. After adjustments, we had Straka's approach number as 1.7 strokes better than Gotterup's.
In our live model, performing 1 stroke better on SG:Approach in Round 1 is worth about 0.06 strokes when projecting Round 2. So Gotterup's -1.6 stroke adjustment to his Round 1 approach SG decreases his Round 2 skill by 0.1 strokes. That's meaningful!
Here are the five largest positive adjustments from Round 1 at the 2026 AT&T:
| player | OTT | APP | ARG | PUTT | Total |
|---|---|---|---|---|---|
| Harris English | -0.01 | +0.54 | +0.11 | +0.44 | +1.07 |
| Tommy Fleetwood | -0.01 | +0.47 | -0.18 | +0.61 | +0.89 |
| Ben Griffin | -0.04 | +0.82 | +0.06 | +0.03 | +0.87 |
| Tom Hoge | -0.04 | +0.35 | +0.13 | +0.32 | +0.76 |
| Nick Taylor | -0.01 | +0.85 | +0.19 | -0.28 | +0.75 |
Nick Taylor had the largest positive adjustment to his approach data because he hit a lot of good-but-not-great approach shots (gaining 0.1-0.3 strokes each) and also had a penalty stroke on 7.
The same logic for approach applies to around-the-green shots and putts. Because these shots are shorter, the returns to SG decrease at a slower rate—hitting it to 3 feet from just off the green involves much less luck than hitting it to 3 feet from 200 yards. Across all rounds, the standard deviation of our APP adjustments is 0.41 strokes, for ARG the standard deviation is 0.19 strokes, and for PUTT it is 0.3 strokes.
For our pre-tournament predictions, we estimate these adjustments for every PGA Tour Shotlink-enabled round in a player's history. In theory, because these adjustments are capturing some element of "luck", a player's average adjustment should converge to zero over a large enough sample. However, under the weighting schemes we used to form our SG averages, the average adjustments remain meaningful: last week they ranged from -0.19 to +0.11 for the field competing at Pebble. We are currently tacking this on to the "SG CATS" column on the player decomposition page, but might reorganize that in the near future.
Recent Posts
Model Talk Archive
2026
2024
2022