June 9, 2026
Introducing our women's data and rankings
We recently added women’s rankings and player profiles to the site. In this blog post,
we provide some detail on how these rankings were constructed and share some interesting
insights from the process.
True SG for Women's Golf
The main input to the women’s rankings is our "true"—or adjusted—strokes-gained data.
This is estimated in the same way as it is for the men, and is meant to measure round-level performance
in a way that can be fairly compared across tournaments and tours. Put simply, it is equal to a player’s
raw SG—the number of strokes better or worse they performed than the field—plus an adjustment for the
strength of that field. (You can read more about true SG
here.)
Adjusted strokes-gained requires a benchmark; i.e., what does a value of zero represent? For the men's game, we use the average performance of players ranked between 125-175th in a given season. This benchmark was chosen to be close to the average PGA Tour field, but still allows a tour’s overall quality to vary year-to-year (in the event of a sudden exodus of top players to a rival tour, for example).
For the women’s game, we use the average performance of players ranked between 120-145th; this roughly corresponds to the average LPGA Tour field, which is what we were targeting to make the baseline comparable to the men’s game. Importantly, this benchmark is specific to each season: a value of +2 in 2005 does not necessarily mean the same thing as a value of +2 in 2025 if fields have gotten deeper over time (more on this later).
Our data includes scores from the four biggest tours (LPGA, KLPGA, JLPGA, LET) plus major championships dating back to 2000. Here is how the average adjusted SG value—strength of field—has evolved on each tour over time:
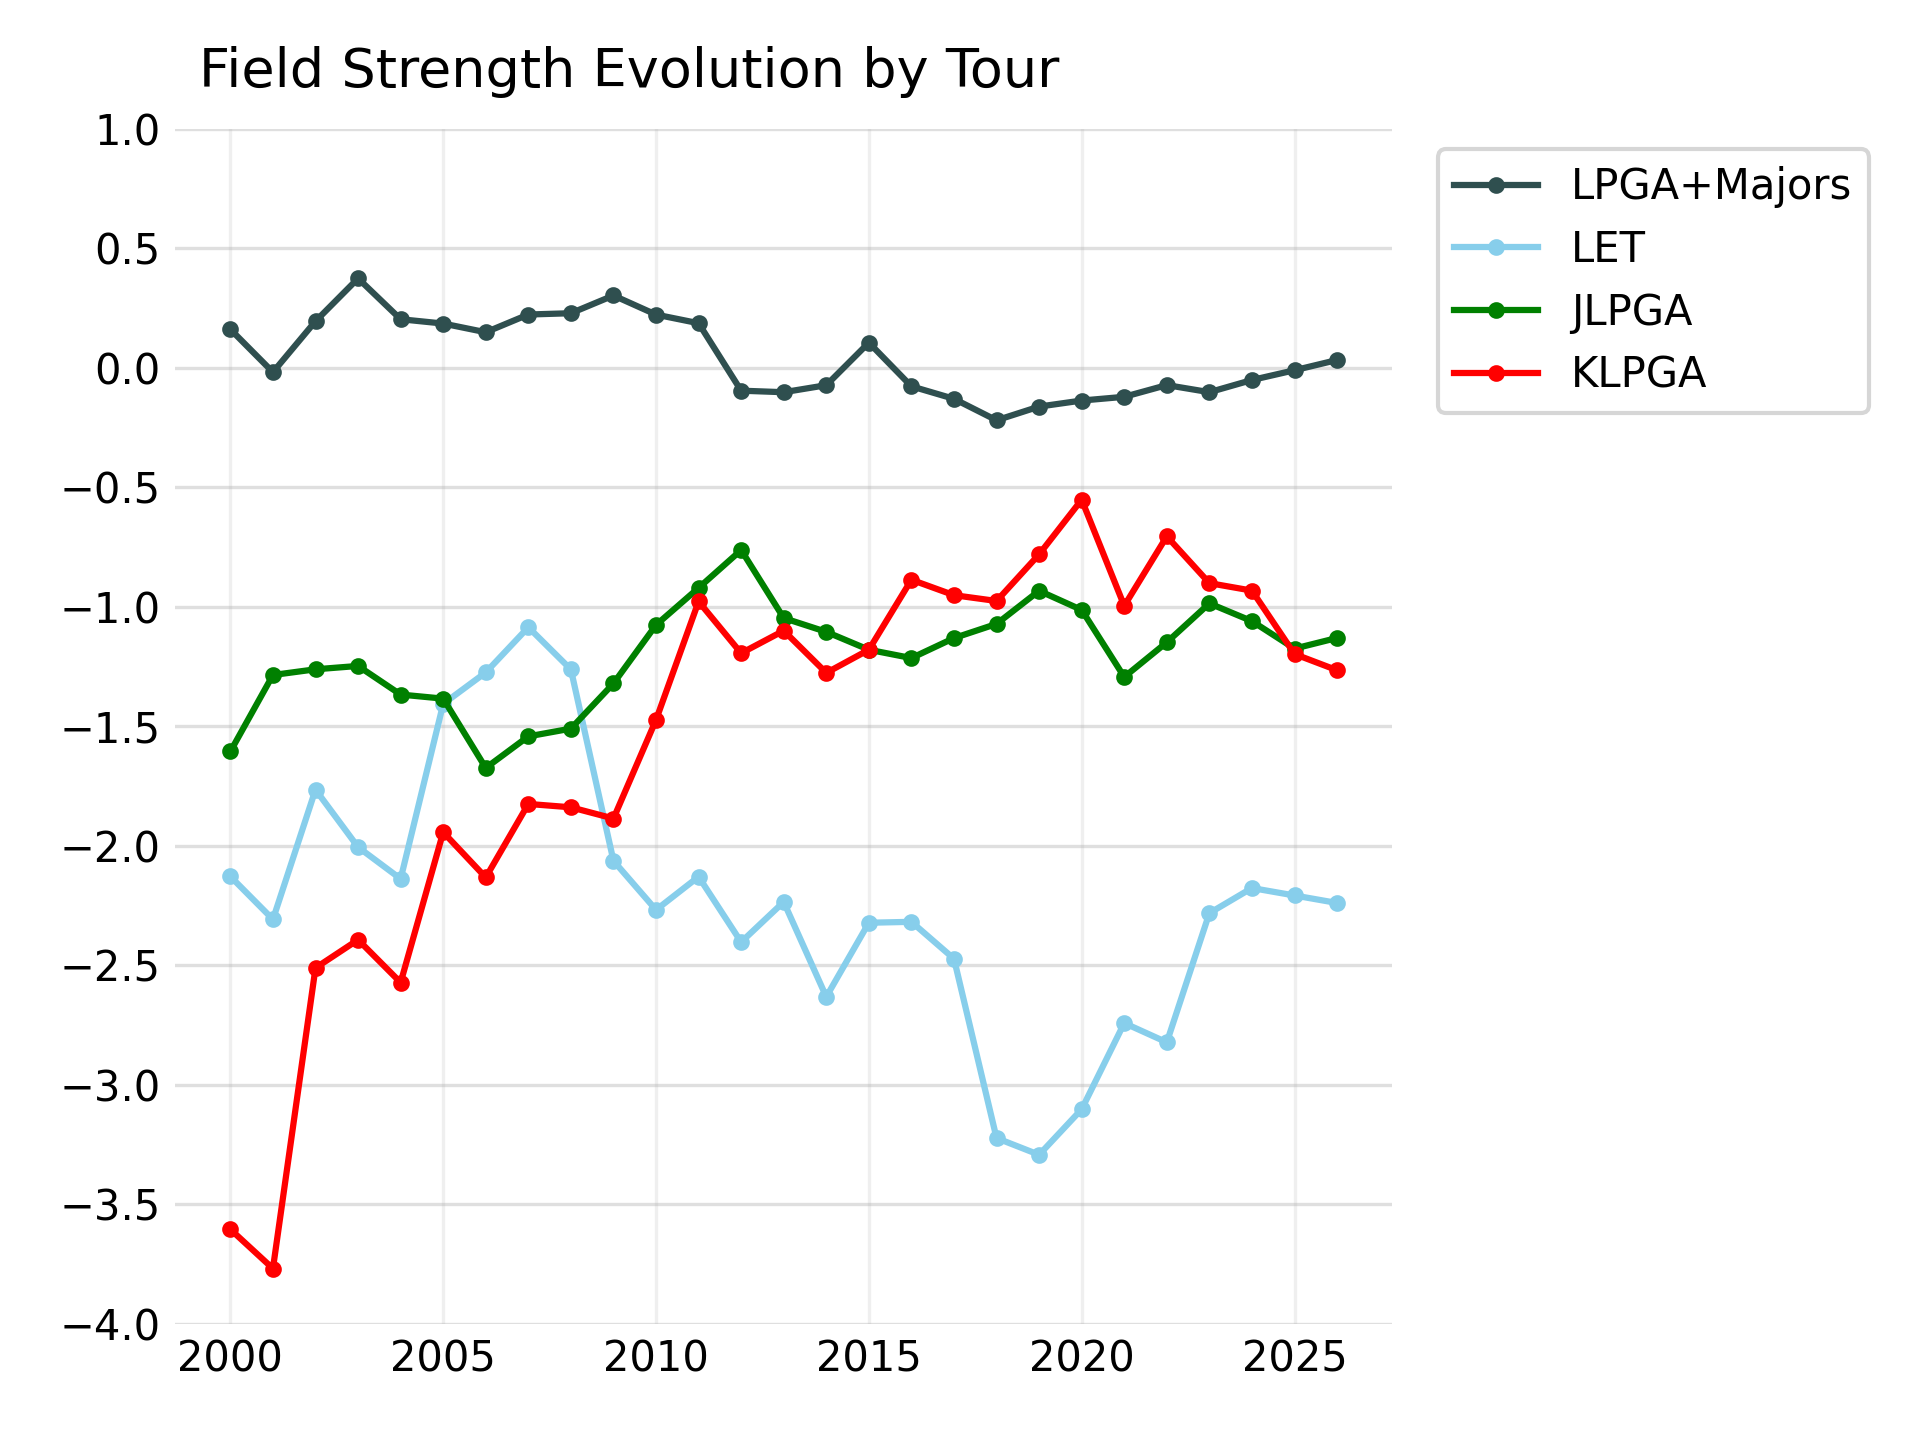
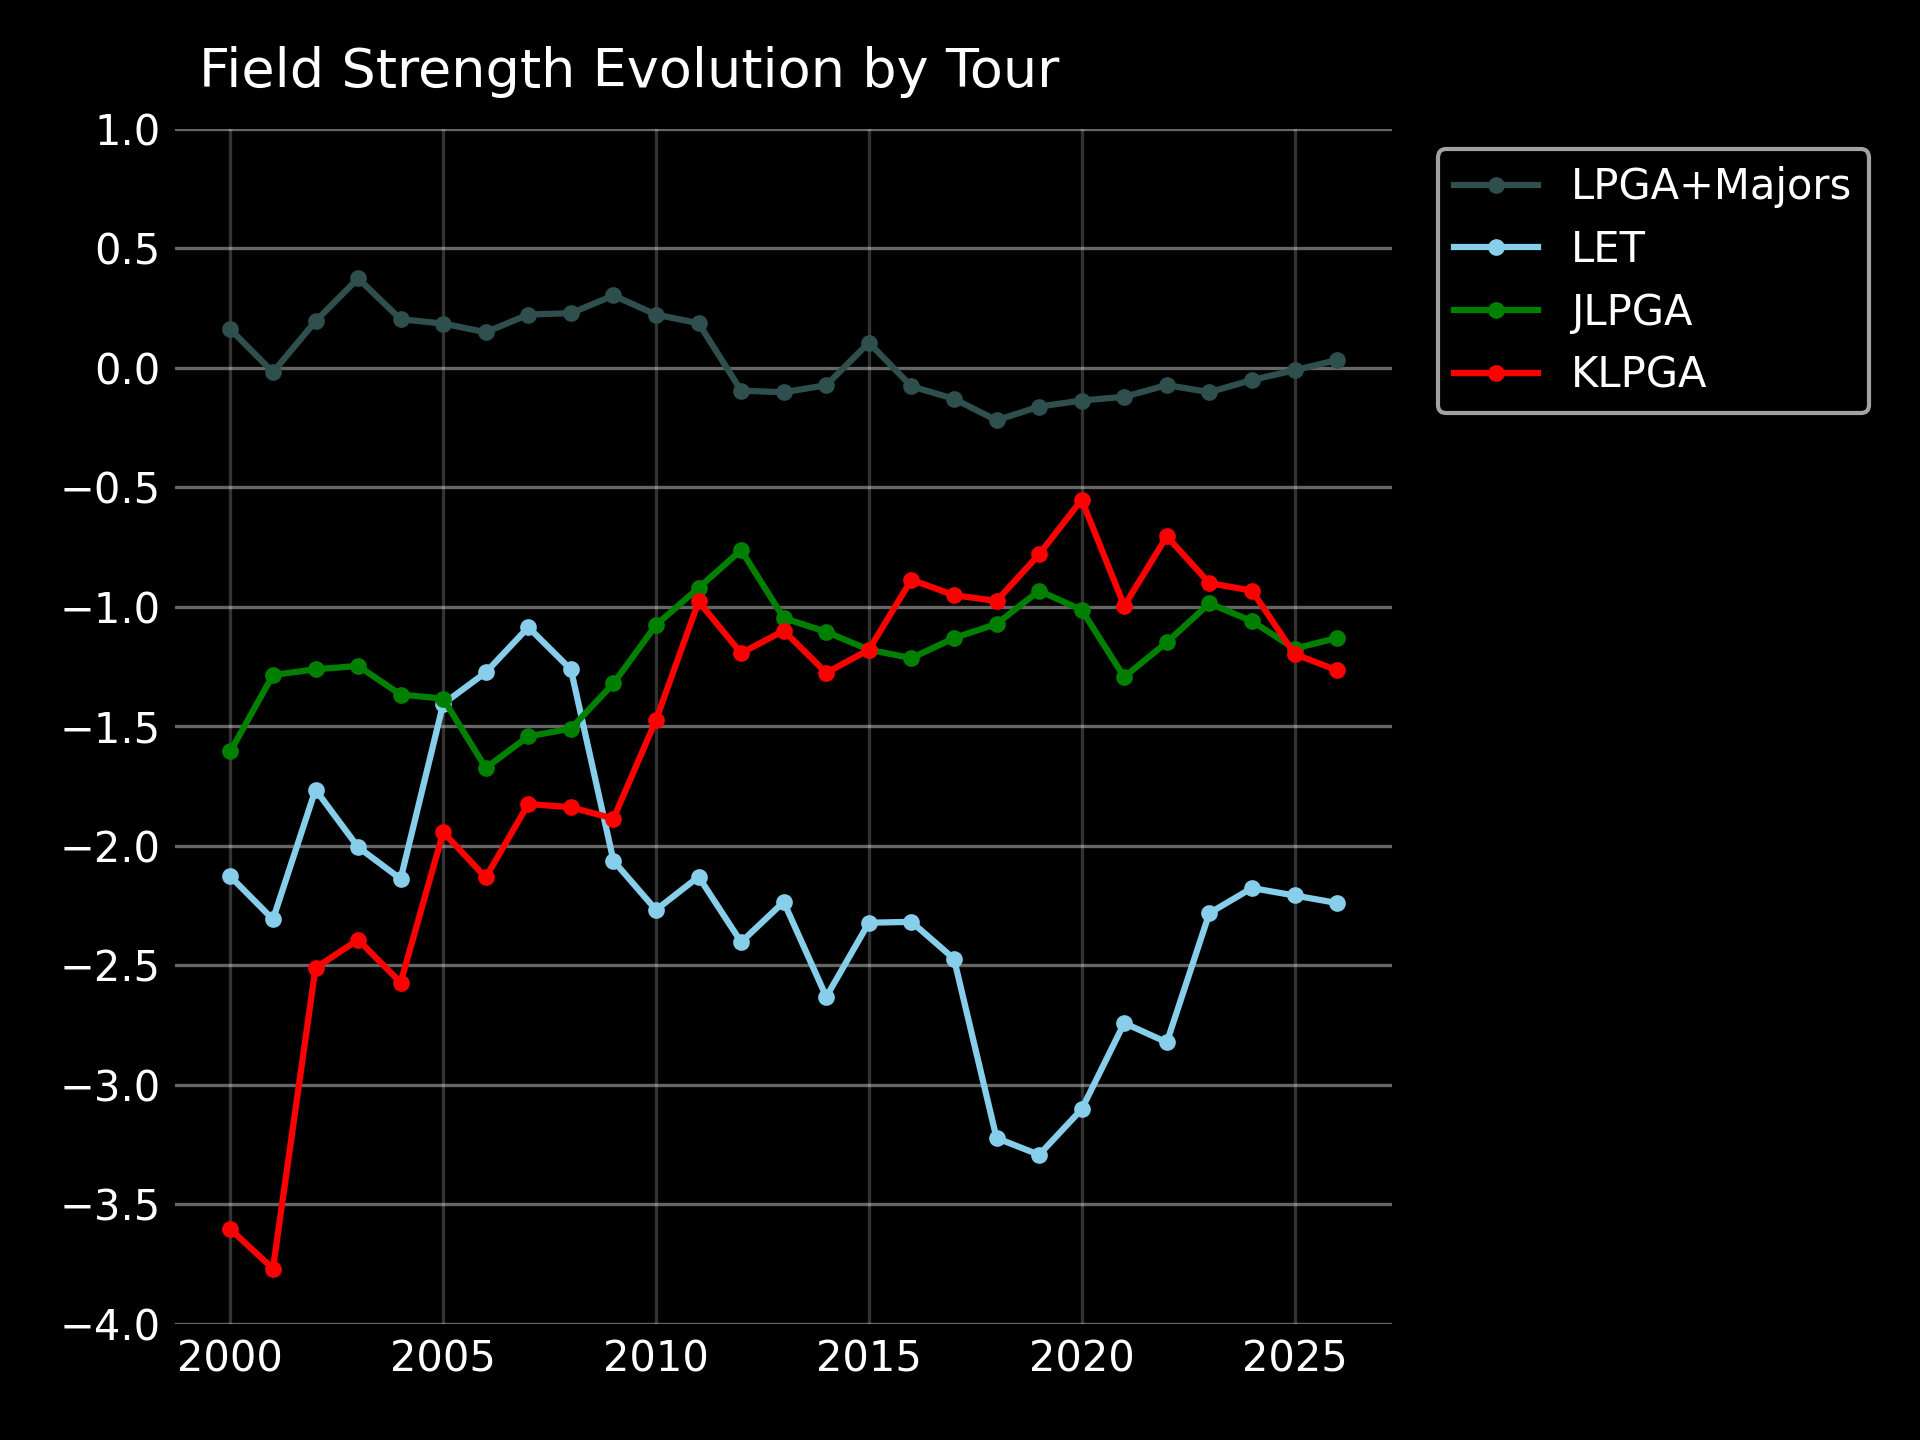 The LPGA’s average SG value was above zero up to 2011 (peaking at +0.37 in 2003),
but has been slightly negative most seasons since then (averaging -0.1 since 2016).
This decline doesn’t mean the LPGA has gotten weaker in an absolute sense,
it simply means that the performance gap between the LPGA and other tours has narrowed.
The average KLPGA field in 2000 was almost 4 strokes per round worse than
the average LPGA field, but that gap has stabilized at just under 1 stroke over the last decade.
The quality of the LET has fluctuated over time, with their low point coming after financial struggles in 2017-2018.
The LPGA’s average SG value was above zero up to 2011 (peaking at +0.37 in 2003),
but has been slightly negative most seasons since then (averaging -0.1 since 2016).
This decline doesn’t mean the LPGA has gotten weaker in an absolute sense,
it simply means that the performance gap between the LPGA and other tours has narrowed.
The average KLPGA field in 2000 was almost 4 strokes per round worse than
the average LPGA field, but that gap has stabilized at just under 1 stroke over the last decade.
The quality of the LET has fluctuated over time, with their low point coming after financial struggles in 2017-2018.
Adjusted strokes-gained requires a benchmark; i.e., what does a value of zero represent? For the men's game, we use the average performance of players ranked between 125-175th in a given season. This benchmark was chosen to be close to the average PGA Tour field, but still allows a tour’s overall quality to vary year-to-year (in the event of a sudden exodus of top players to a rival tour, for example).
For the women’s game, we use the average performance of players ranked between 120-145th; this roughly corresponds to the average LPGA Tour field, which is what we were targeting to make the baseline comparable to the men’s game. Importantly, this benchmark is specific to each season: a value of +2 in 2005 does not necessarily mean the same thing as a value of +2 in 2025 if fields have gotten deeper over time (more on this later).
Our data includes scores from the four biggest tours (LPGA, KLPGA, JLPGA, LET) plus major championships dating back to 2000. Here is how the average adjusted SG value—strength of field—has evolved on each tour over time:
Rankings and Benchmarks
Our rankings are calculated by averaging each player’s adjusted SG values,
with recent rounds receiving more weight. (The most recent 50 rounds receive ~70% of the weight,
rounds 51-100 receive 20%, and 100+ receive 10%.) This weighted average,
along with some minor adjustments for the overall recency of a player’s data
and regression to the mean, is called the DG Index.
It is our estimate of a player’s current skill, and indicates how many strokes
per round they are expected to gain (or lose) against our baseline player.
We calculate these rankings retroactively for every week since the start of 2001.
Among the top 100 players in our current rankings, 68 play on the LPGA as their primary tour, 16 on the KLPGA, 13 on the JLPGA, and 3 on the LET. Here’s how that distribution has evolved since 2001:
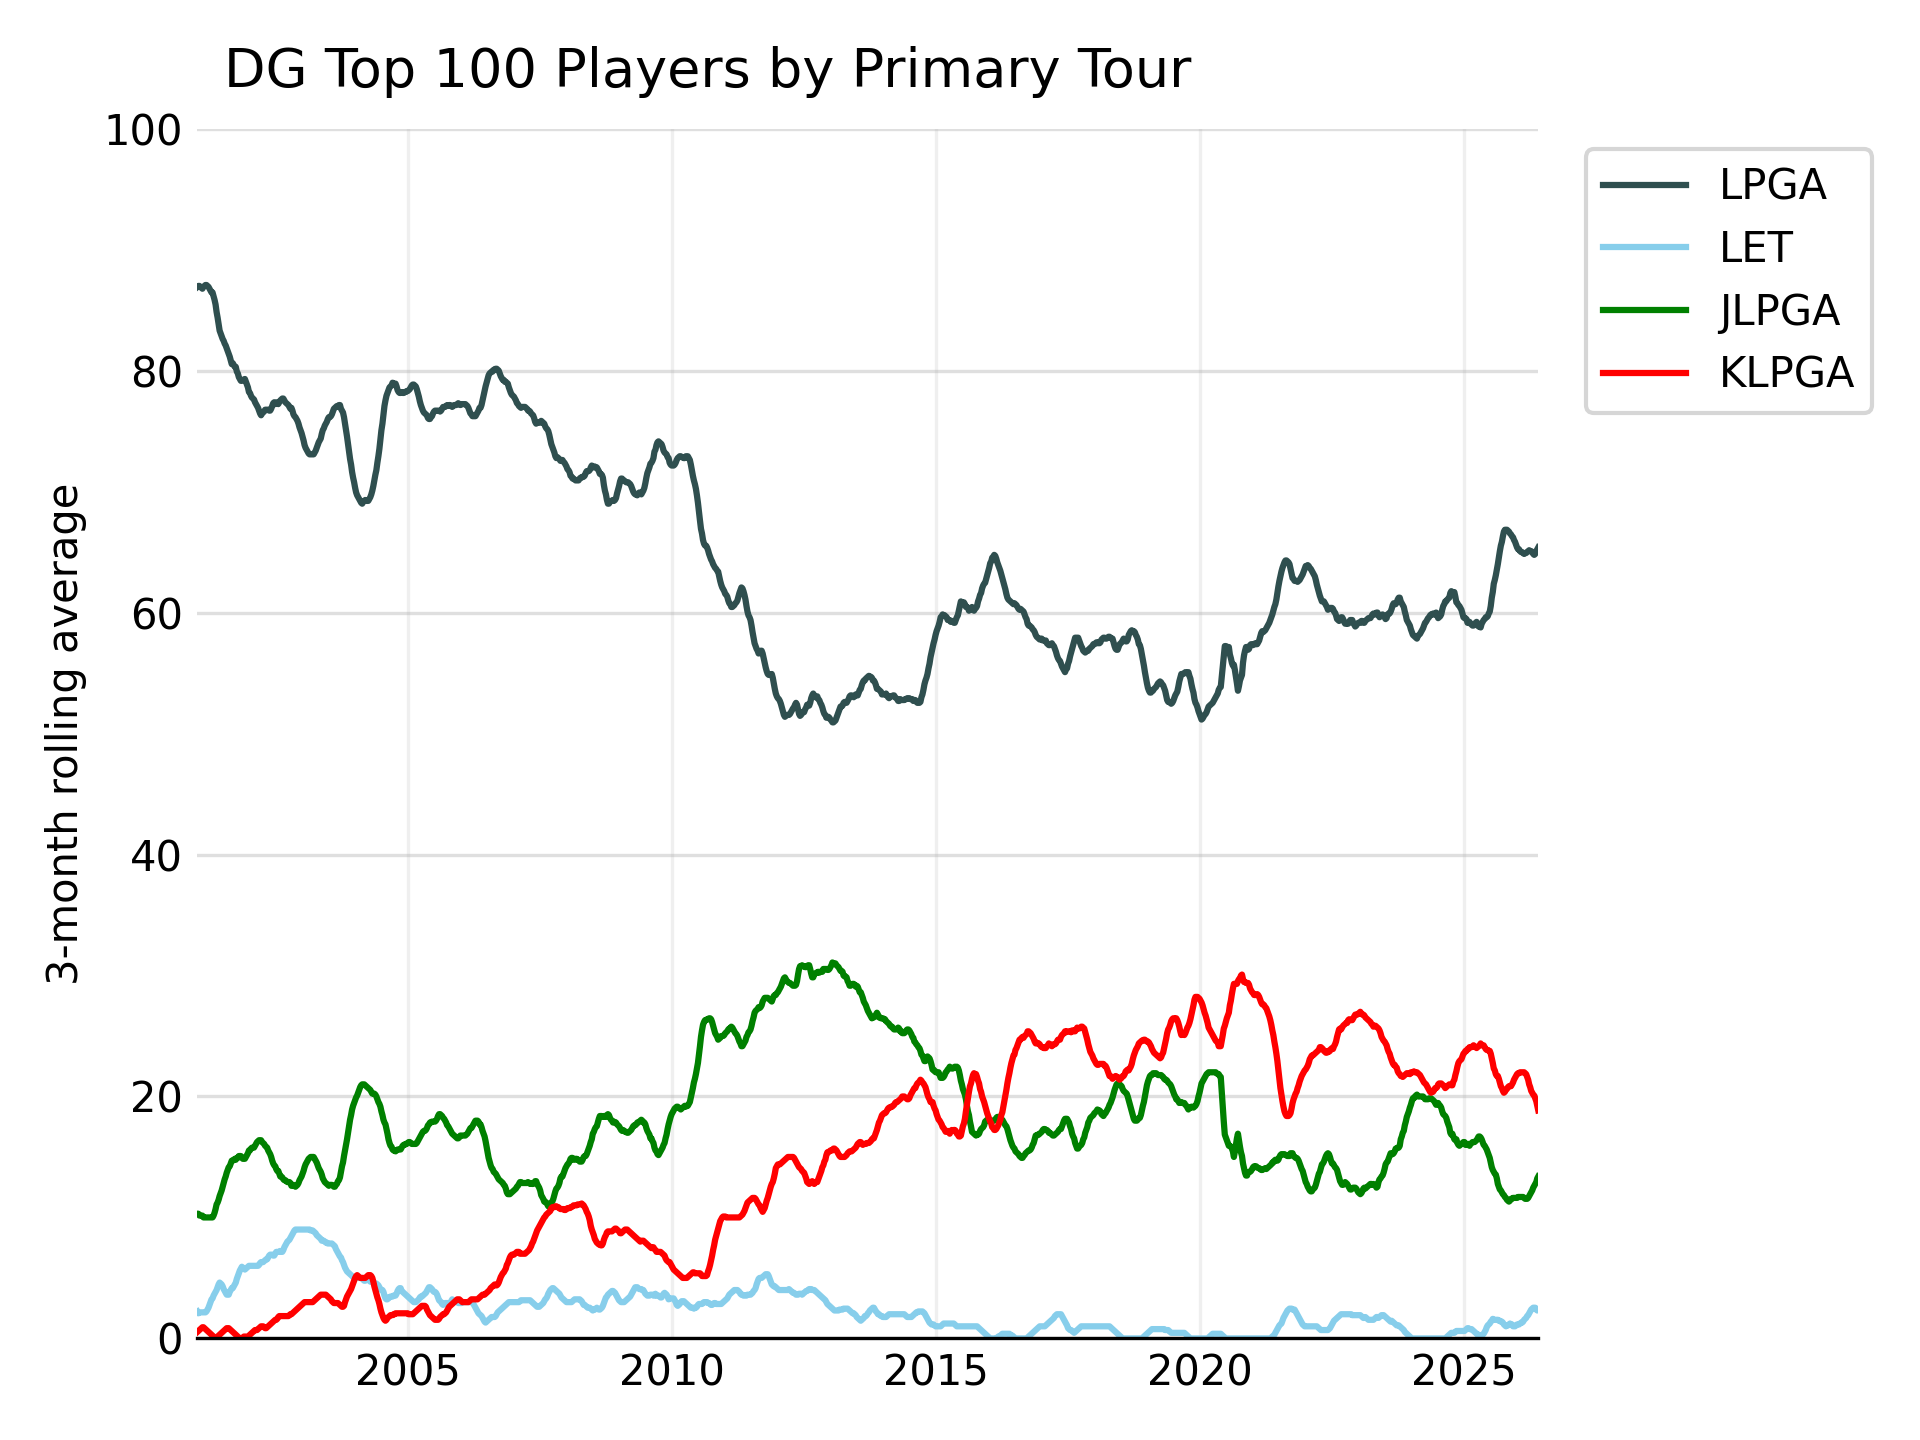
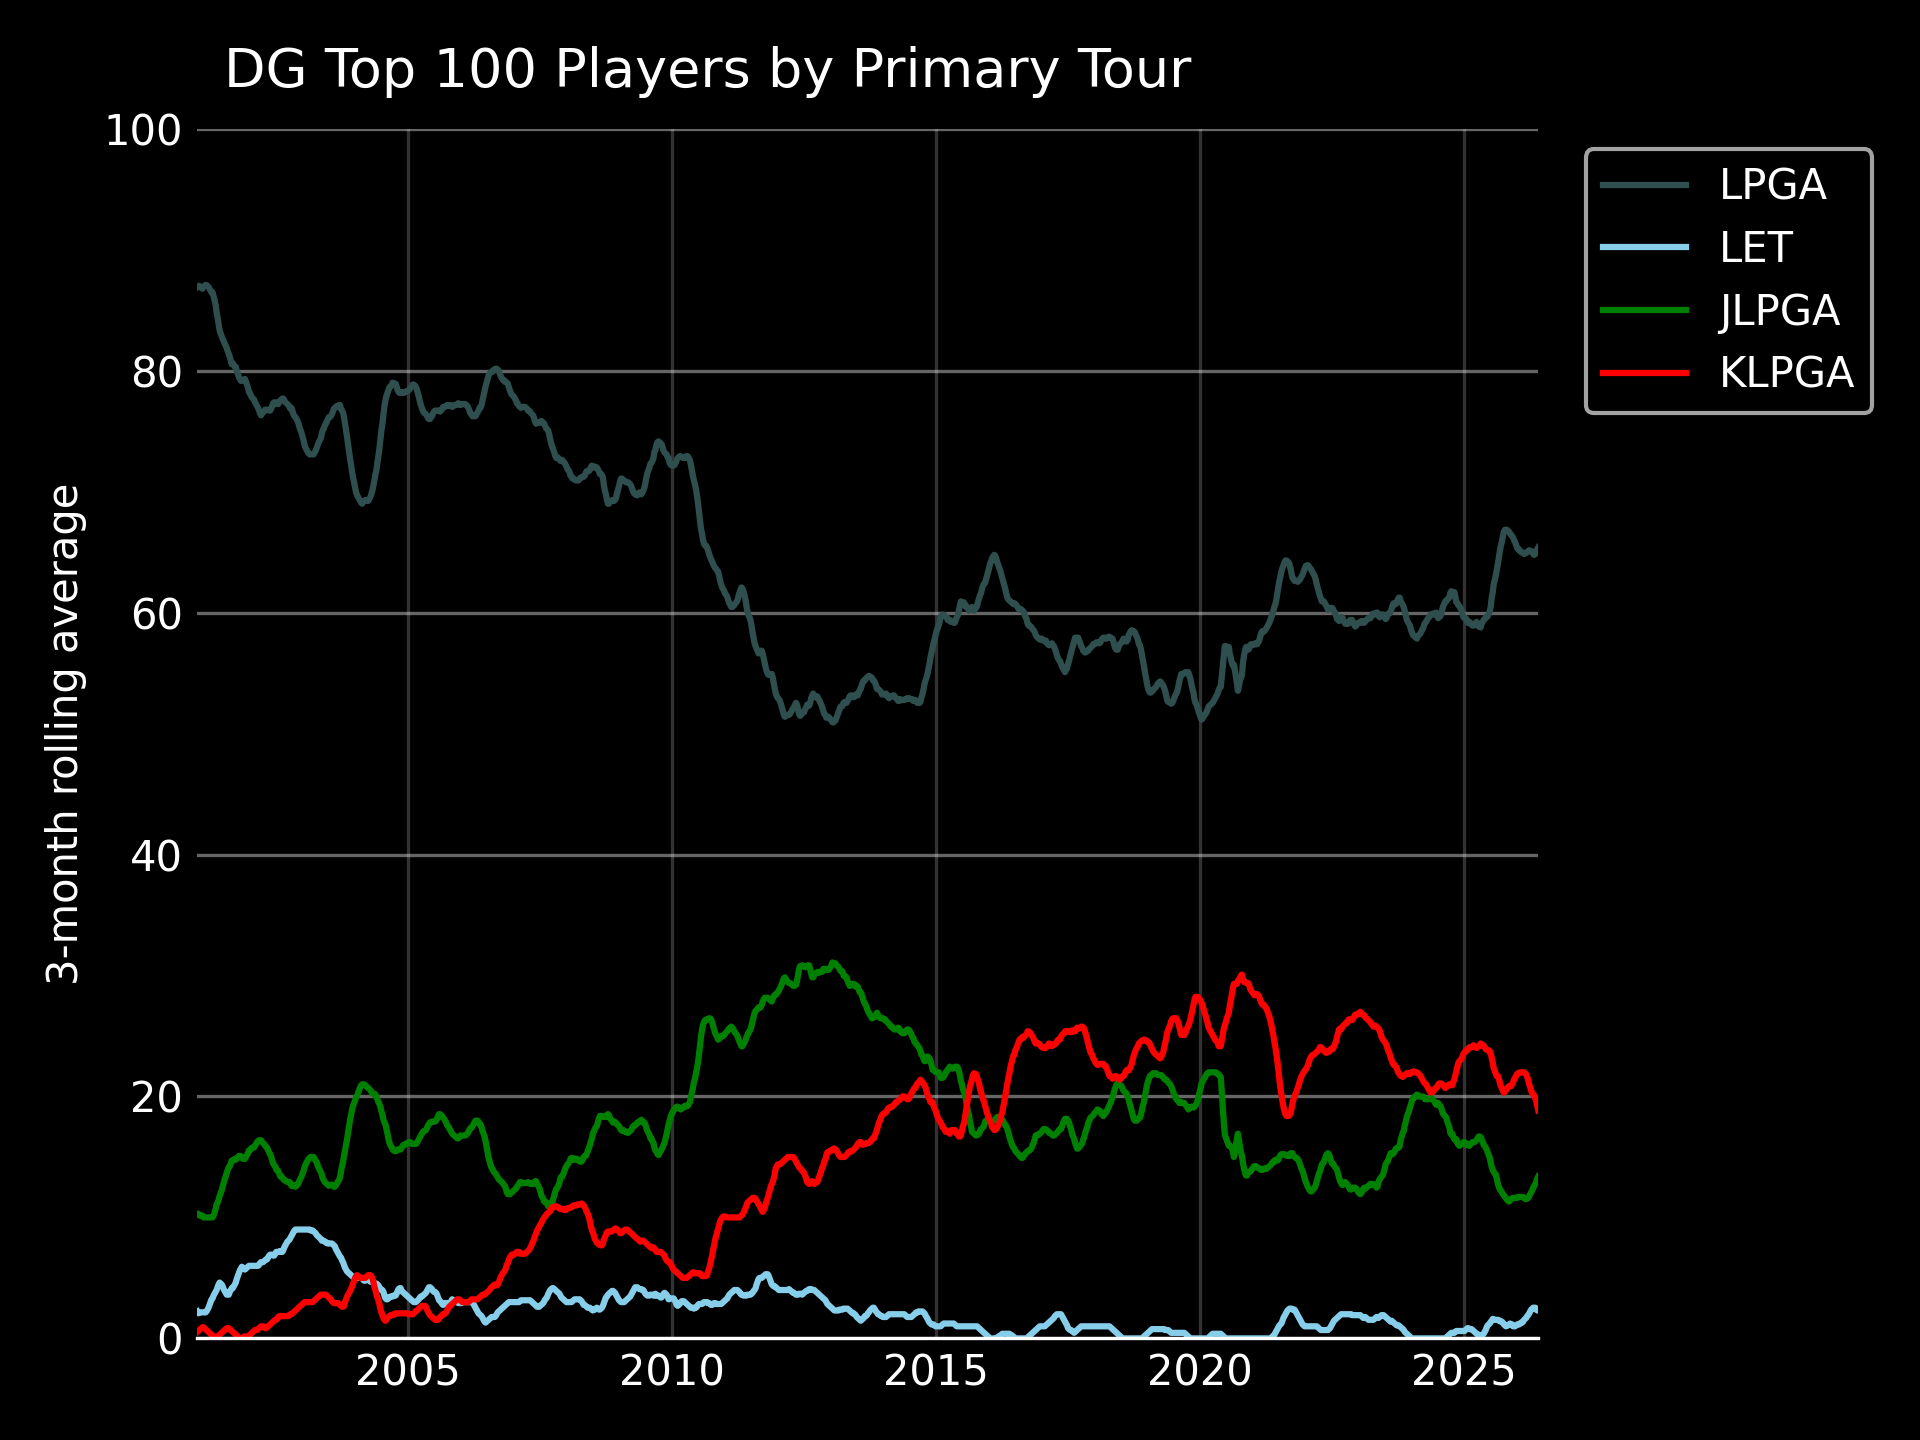 The JLPGA gave the LPGA a scare in the early 2010s, briefly reaching 31 players
in the top 100 compared to the LPGA’s 50. Since then we’ve settled into an
equilibrium where the majority of top players play on the LPGA,
but meaningful groups stay in Japan and Korea, including the occasional near-elite player.
The JLPGA gave the LPGA a scare in the early 2010s, briefly reaching 31 players
in the top 100 compared to the LPGA’s 50. Since then we’ve settled into an
equilibrium where the majority of top players play on the LPGA,
but meaningful groups stay in Japan and Korea, including the occasional near-elite player.
To get the most out of our adjusted SG data, it’s helpful to understand the meaning of a few benchmark SG levels. At the time of writing (June 2026), Nelly Korda leads our rankings with a DG Index of +3.16. There are four players with a skill level above +2, and 14 players with skills above +1.5. On the men’s side, Scottie leads our rankings with an index of +2.86; there are three players with skills above +2, and 12 above +1.5. Therefore, the current distribution of skill at the top end in the men’s and women’s games is fairly well-aligned.
A rough rule we use for the men’s game is that performing at a +2 SG level makes you a top 5 player in the world; +2.5 should put you close to the best in the world, while +3 is historically great. These rules generally apply to the women’s game for recent seasons, but as we go further back things look a bit different. Here’s how the distribution of skill has evolved in the men’s and women’s games:
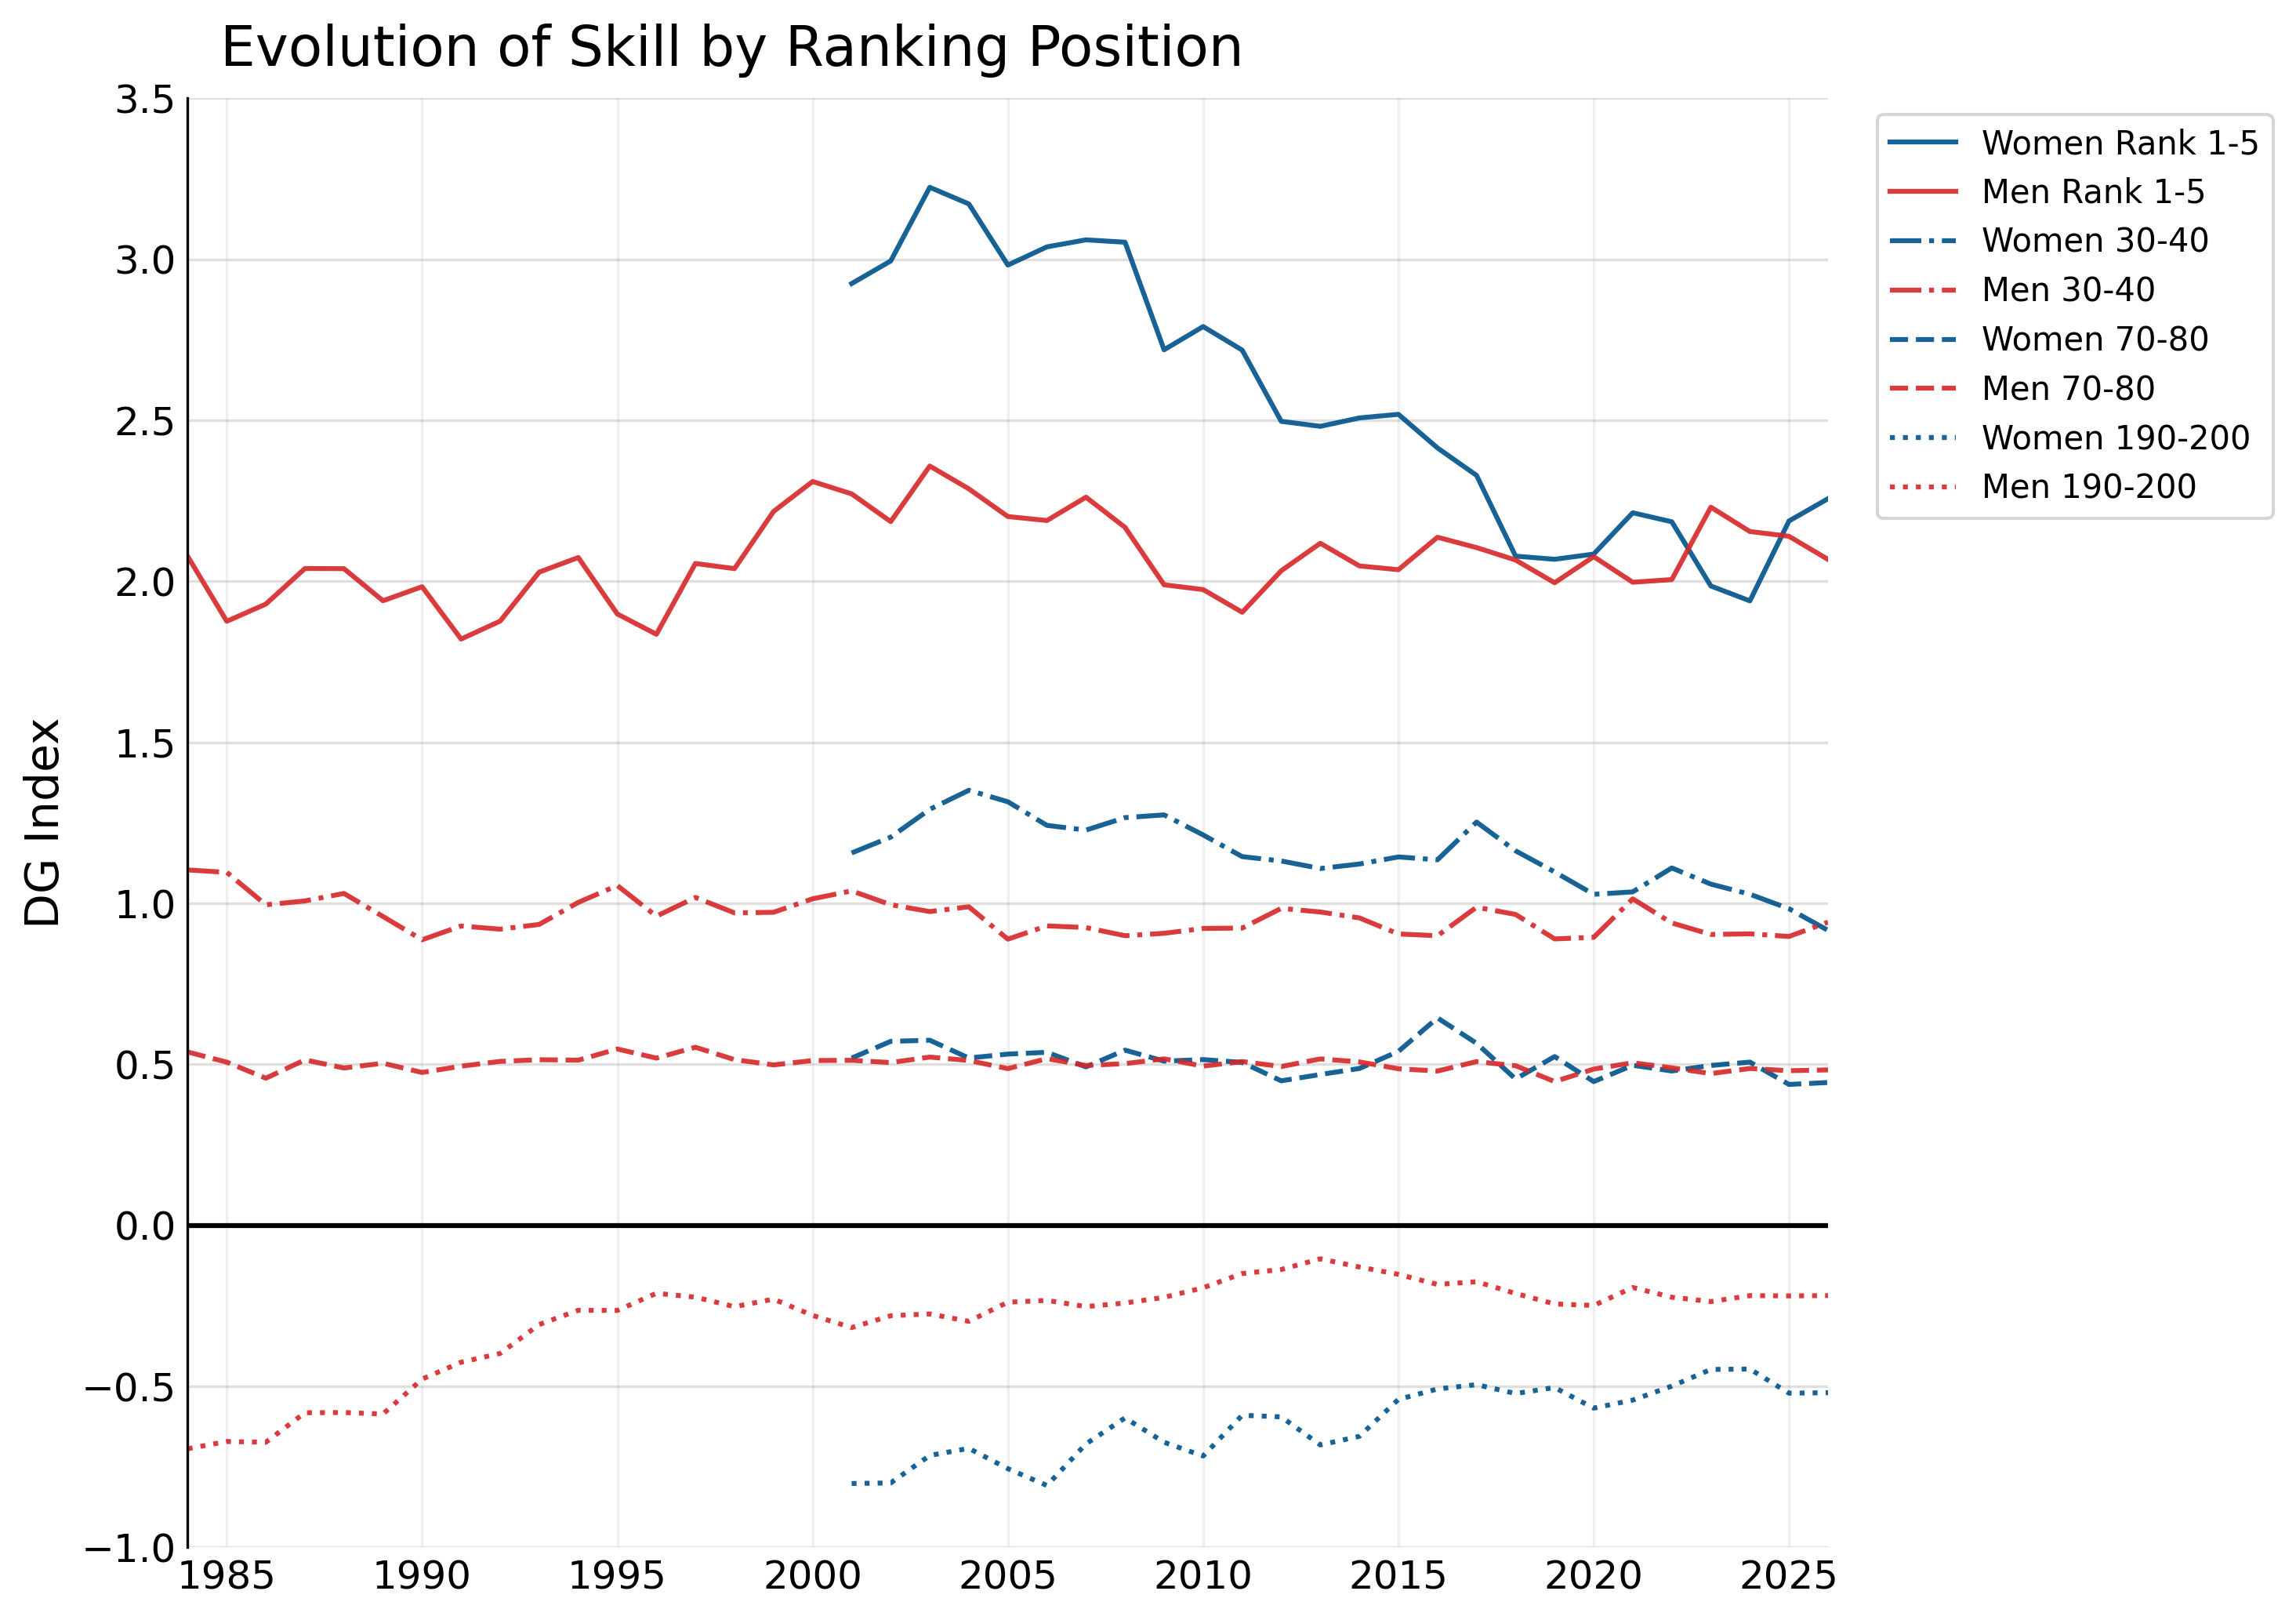
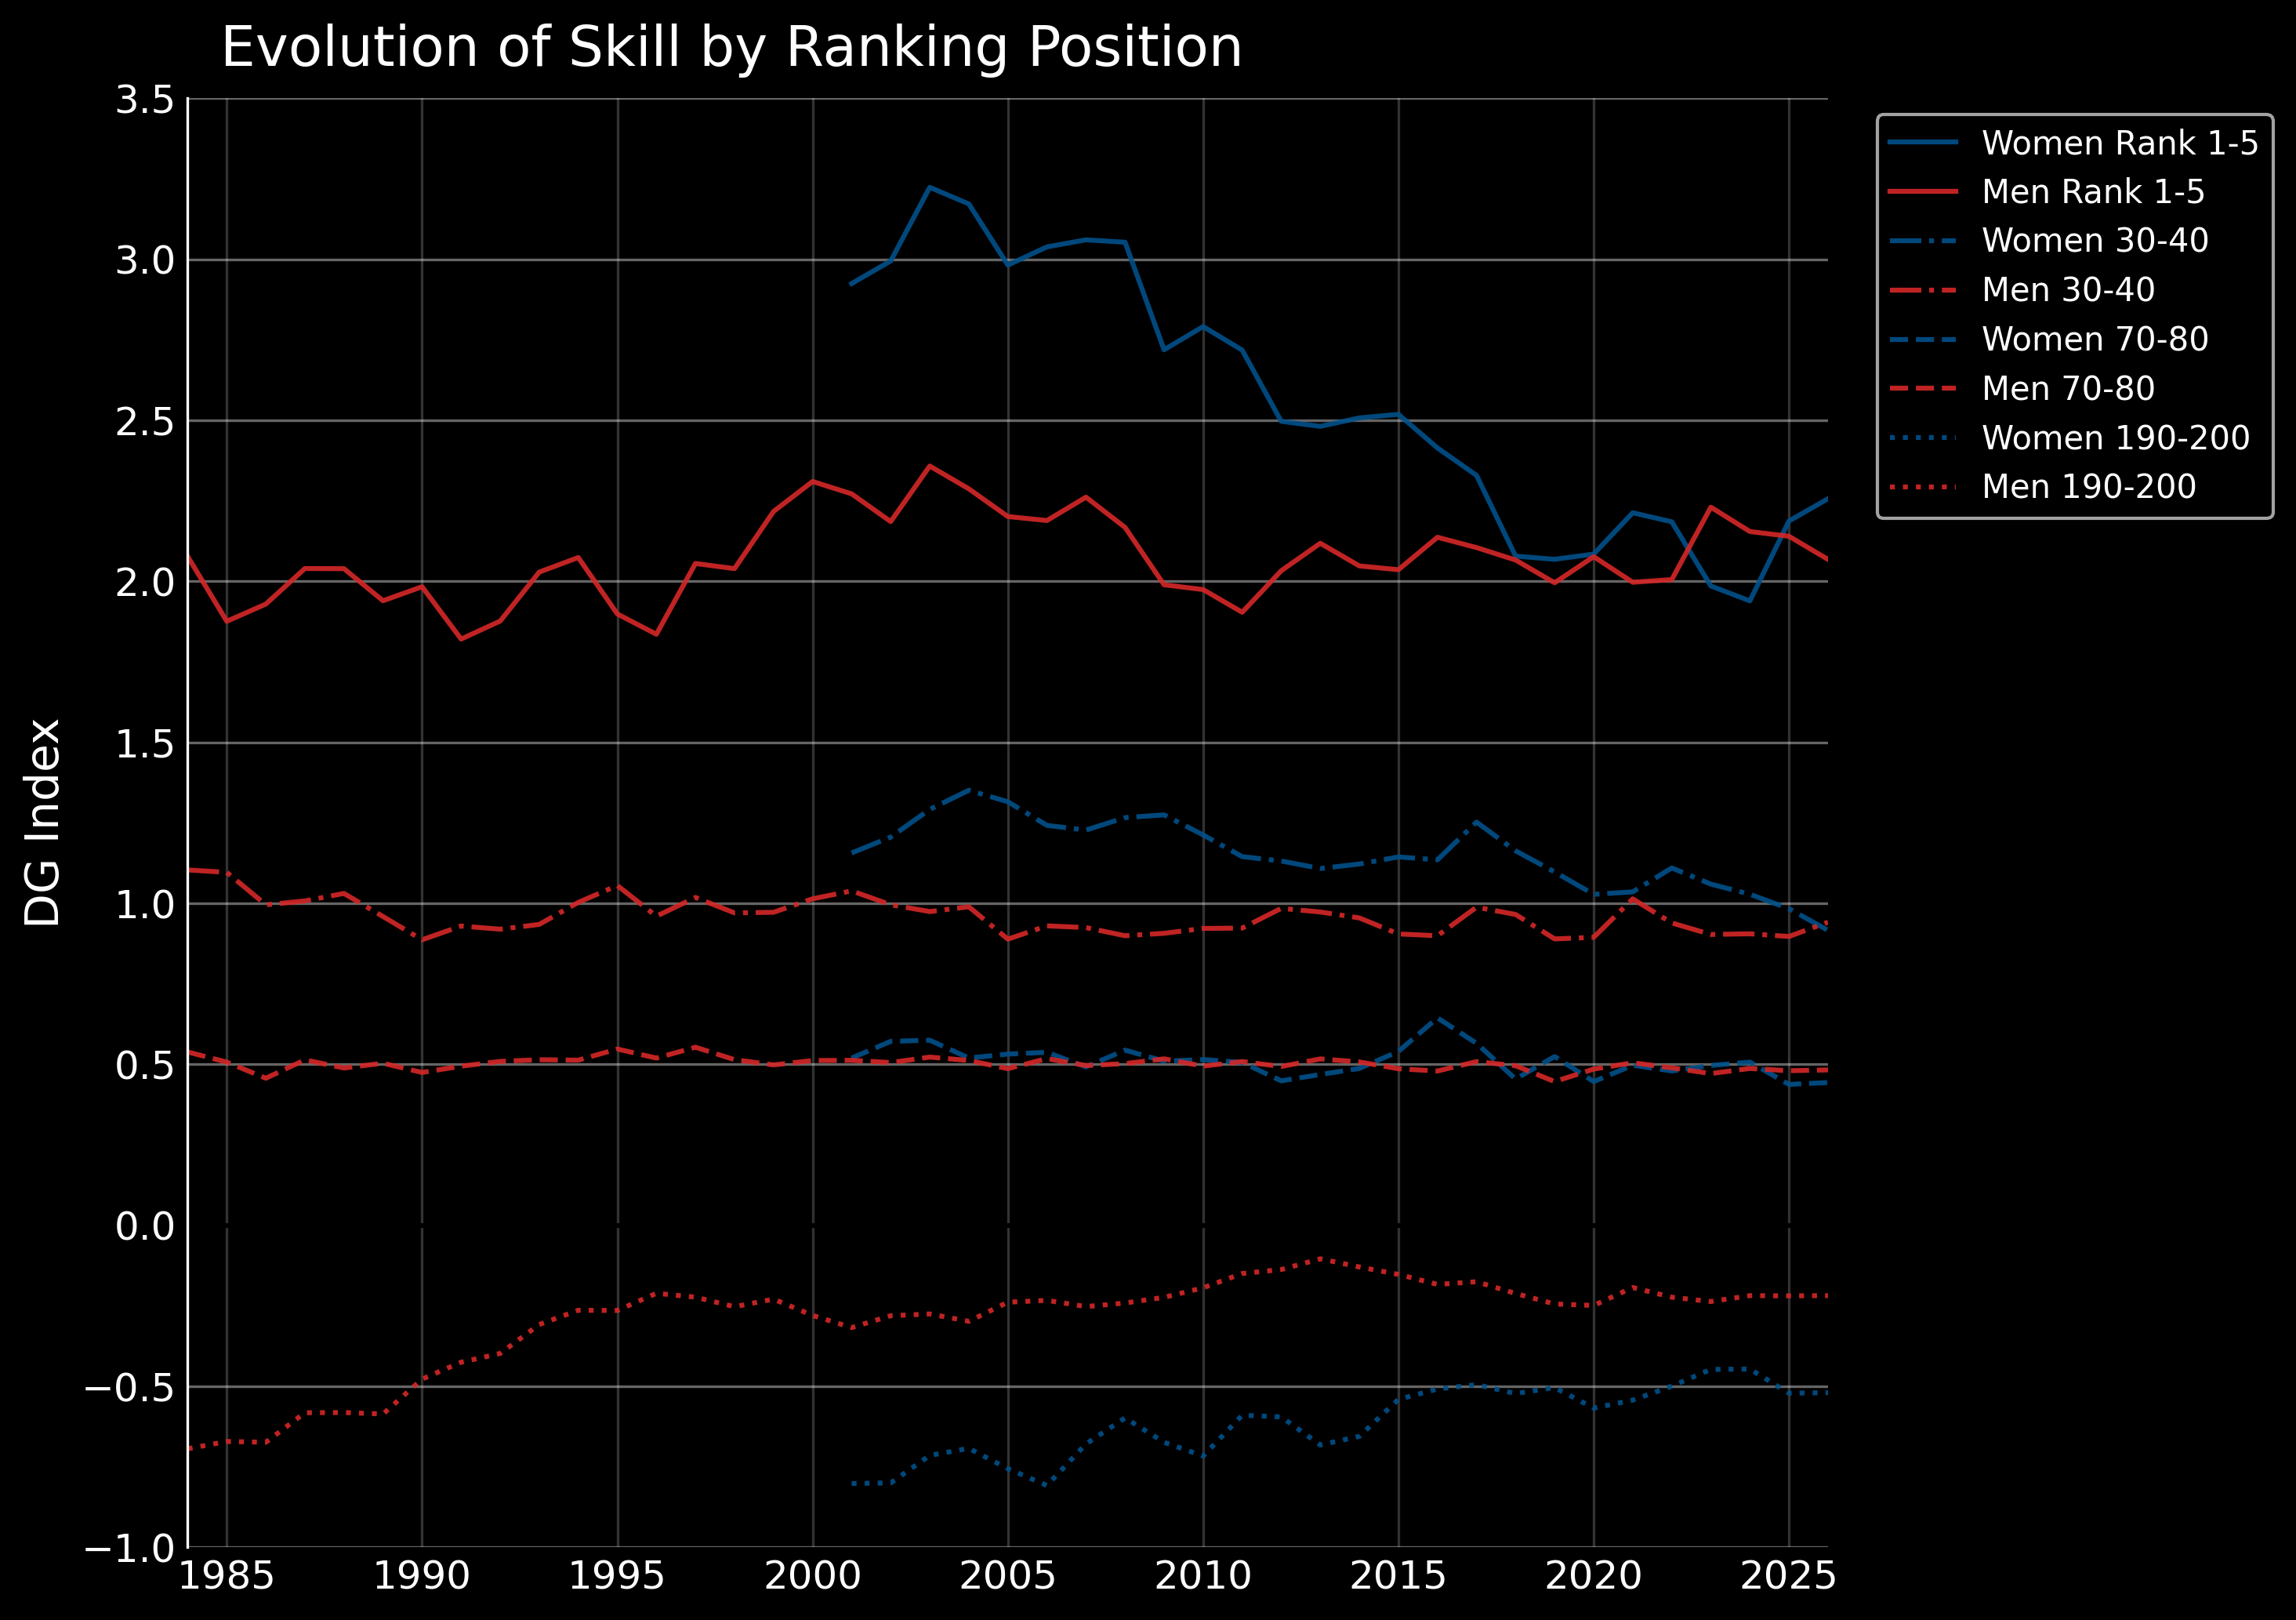 In the early 2000s, the average skill of the top 5 women in our rankings was slightly above +3.
This average has declined steadily since 2002 and has stabilized around +2. As before,
this doesn’t mean that the top women are worse than they used to be, it simply means
that the gap between the best players and the ~130th-best has shrunk over the last two decades.
At the other end of the distribution, the average index of players ranked 190-200 has risen steadily since 2005.
(Recall that our choice of SG baseline means that players ranked 120-145 will have an average
skill near zero in every year.)
In the early 2000s, the average skill of the top 5 women in our rankings was slightly above +3.
This average has declined steadily since 2002 and has stabilized around +2. As before,
this doesn’t mean that the top women are worse than they used to be, it simply means
that the gap between the best players and the ~130th-best has shrunk over the last two decades.
At the other end of the distribution, the average index of players ranked 190-200 has risen steadily since 2005.
(Recall that our choice of SG baseline means that players ranked 120-145 will have an average
skill near zero in every year.)
Taken together, this shows that the skill distribution in the women’s game has narrowed substantially over the last twenty years. In other words, the sport has become much deeper.
On the men’s side, the top half of the skill distribution has been remarkably stable since 1983. This is a bit at odds with the narrative—and with some of our past writing—that the men’s game has gotten deeper over the last two decades, but keep in mind that this plot doesn’t say anything about how the quality of the average pro has changed over time.
The main takeaway here is that, for current players in the women’s game, it’s fine to use the same performance benchmarks that we are accustomed to on the men's side: consistently performing at a +3 level is historically good, +2.5 is best-in-the-world territory, and +2 is top-5-player quality. However, as we move further into the past, these benchmarks no longer hold. In the early 2000s, it was common to have several women above +3 skill. Averaging +2.5 SG would make you a top-5 player, while +2 would only put you around 10-15th in the world.
Among the top 100 players in our current rankings, 68 play on the LPGA as their primary tour, 16 on the KLPGA, 13 on the JLPGA, and 3 on the LET. Here’s how that distribution has evolved since 2001:
To get the most out of our adjusted SG data, it’s helpful to understand the meaning of a few benchmark SG levels. At the time of writing (June 2026), Nelly Korda leads our rankings with a DG Index of +3.16. There are four players with a skill level above +2, and 14 players with skills above +1.5. On the men’s side, Scottie leads our rankings with an index of +2.86; there are three players with skills above +2, and 12 above +1.5. Therefore, the current distribution of skill at the top end in the men’s and women’s games is fairly well-aligned.
A rough rule we use for the men’s game is that performing at a +2 SG level makes you a top 5 player in the world; +2.5 should put you close to the best in the world, while +3 is historically great. These rules generally apply to the women’s game for recent seasons, but as we go further back things look a bit different. Here’s how the distribution of skill has evolved in the men’s and women’s games:
Taken together, this shows that the skill distribution in the women’s game has narrowed substantially over the last twenty years. In other words, the sport has become much deeper.
On the men’s side, the top half of the skill distribution has been remarkably stable since 1983. This is a bit at odds with the narrative—and with some of our past writing—that the men’s game has gotten deeper over the last two decades, but keep in mind that this plot doesn’t say anything about how the quality of the average pro has changed over time.
The main takeaway here is that, for current players in the women’s game, it’s fine to use the same performance benchmarks that we are accustomed to on the men's side: consistently performing at a +3 level is historically good, +2.5 is best-in-the-world territory, and +2 is top-5-player quality. However, as we move further into the past, these benchmarks no longer hold. In the early 2000s, it was common to have several women above +3 skill. Averaging +2.5 SG would make you a top-5 player, while +2 would only put you around 10-15th in the world.
All-Time Rankings
As we’ve done for the men, we can create a women’s all-time ranking by ordering players by their peak DG Index.
The top 20 are shown below:
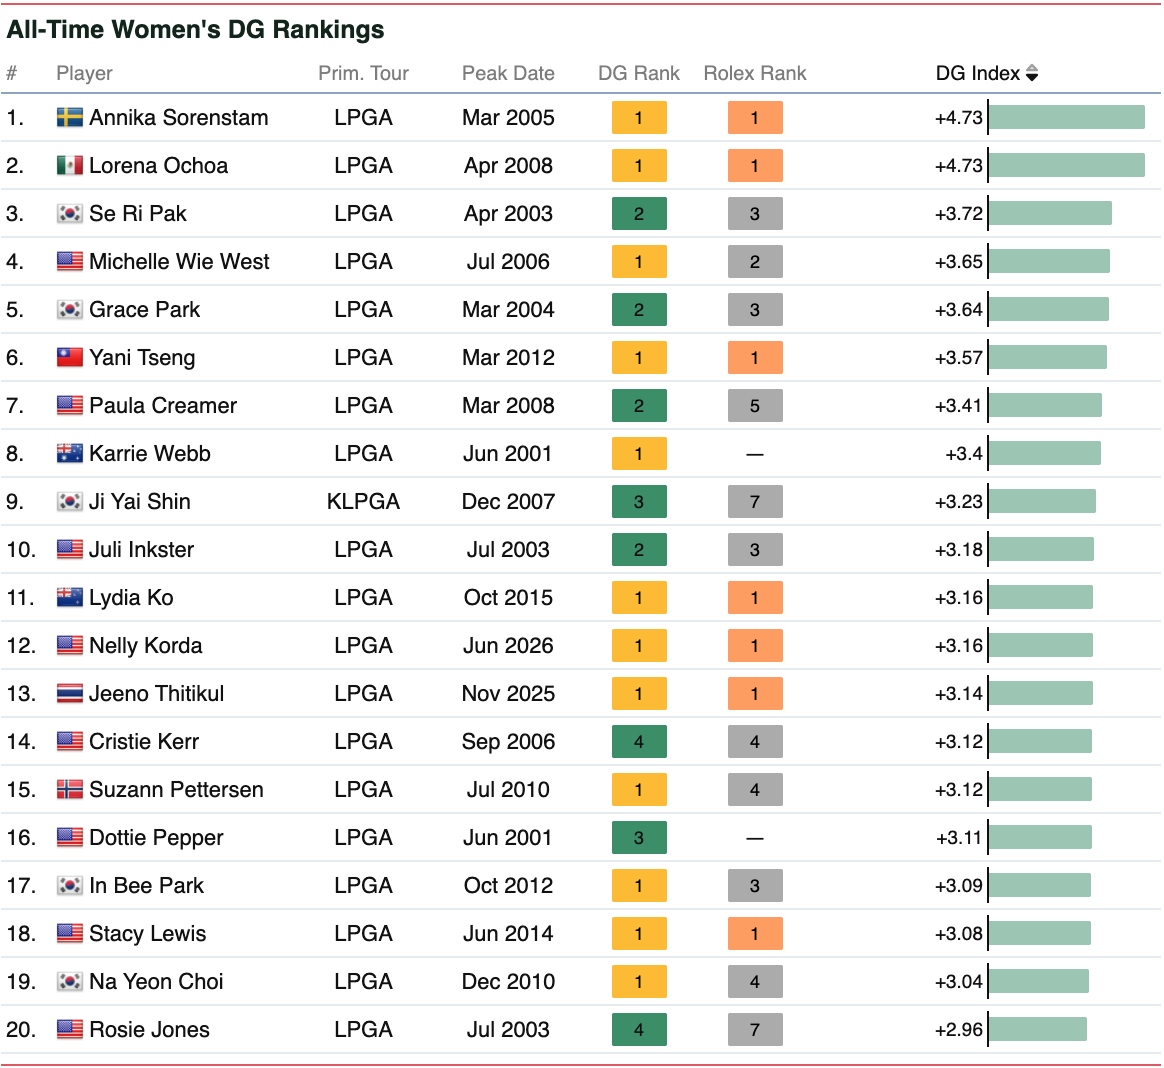
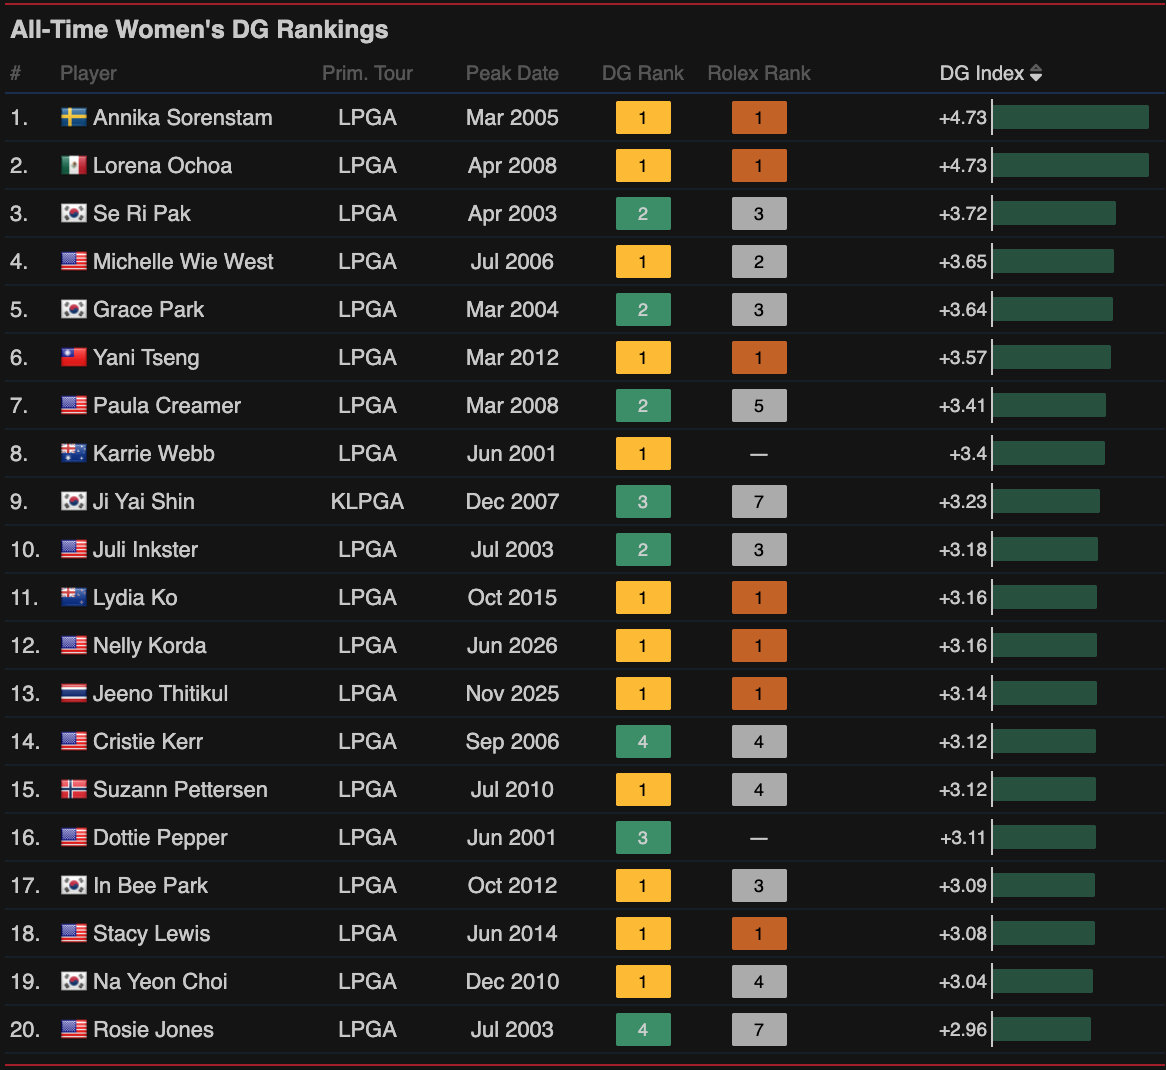 Annika Sorenstam and
Lorena Ochoa top the list with nearly identical peaks of +4.73.
Sorenstam’s peak came in March 2005 after winning five straight starts and 8 of her last 10,
while Ochoa reached hers in April 2008 after winning four straight and 10 of her last 15 events.
Annika’s dominance was more sustained than Ochoa’s, as she spent 166 weeks with a skill above +4,
while Ochoa only spent 66.
Annika Sorenstam and
Lorena Ochoa top the list with nearly identical peaks of +4.73.
Sorenstam’s peak came in March 2005 after winning five straight starts and 8 of her last 10,
while Ochoa reached hers in April 2008 after winning four straight and 10 of her last 15 events.
Annika’s dominance was more sustained than Ochoa’s, as she spent 166 weeks with a skill above +4,
while Ochoa only spent 66.
Readers familiar with our men’s all-time list will know that Tiger’s DG Index peak was "only" +3.9, which he reached at the end of his historic 2000 season. However, the previous section makes clear that comparing Tiger to Sorenstam and Ochoa is not apples-to-apples given how much greater the separation was at the top of the women’s game in the early 2000s. Only three men—Tiger, Scottie, and Norman—have reached a +3 DG Index since 1983, compared to the 19 women that have done it since 2000.
Another way to assess a player’s dominance is to look at their separation from their closest peer. The plots below show the difference in DG index between the #1 and #2 players in our women’s and men’s rankings over time:
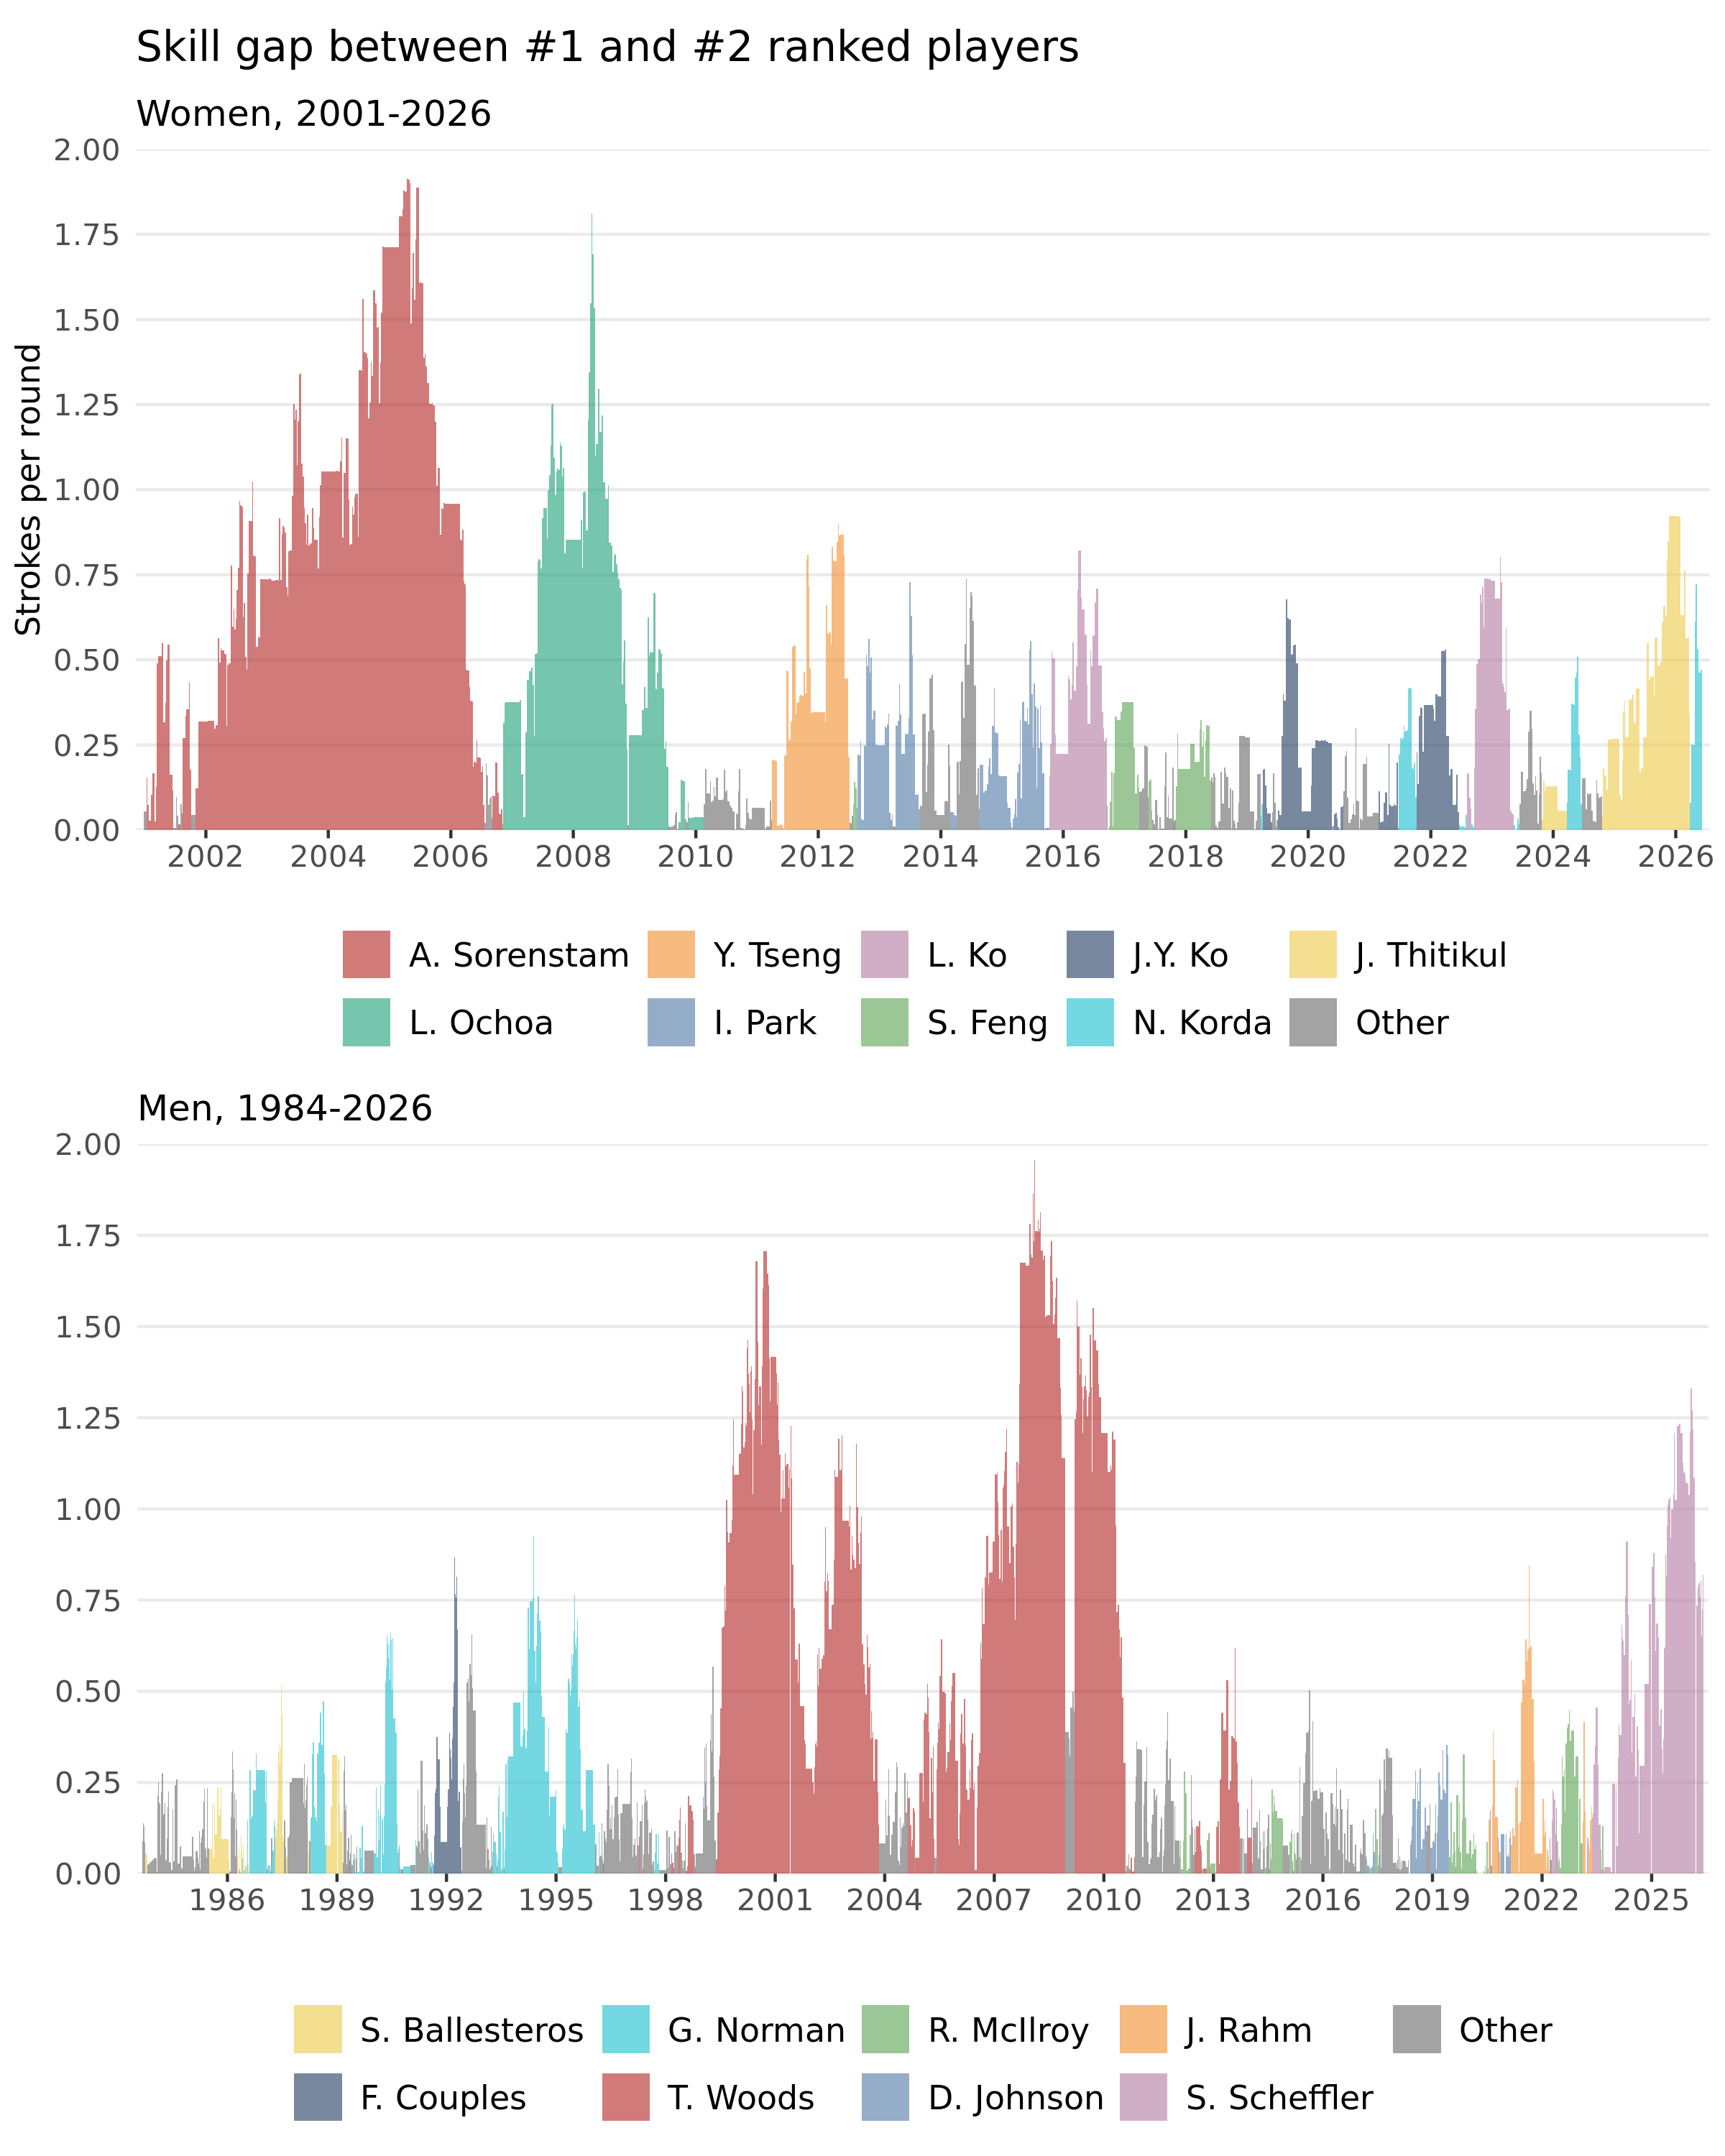
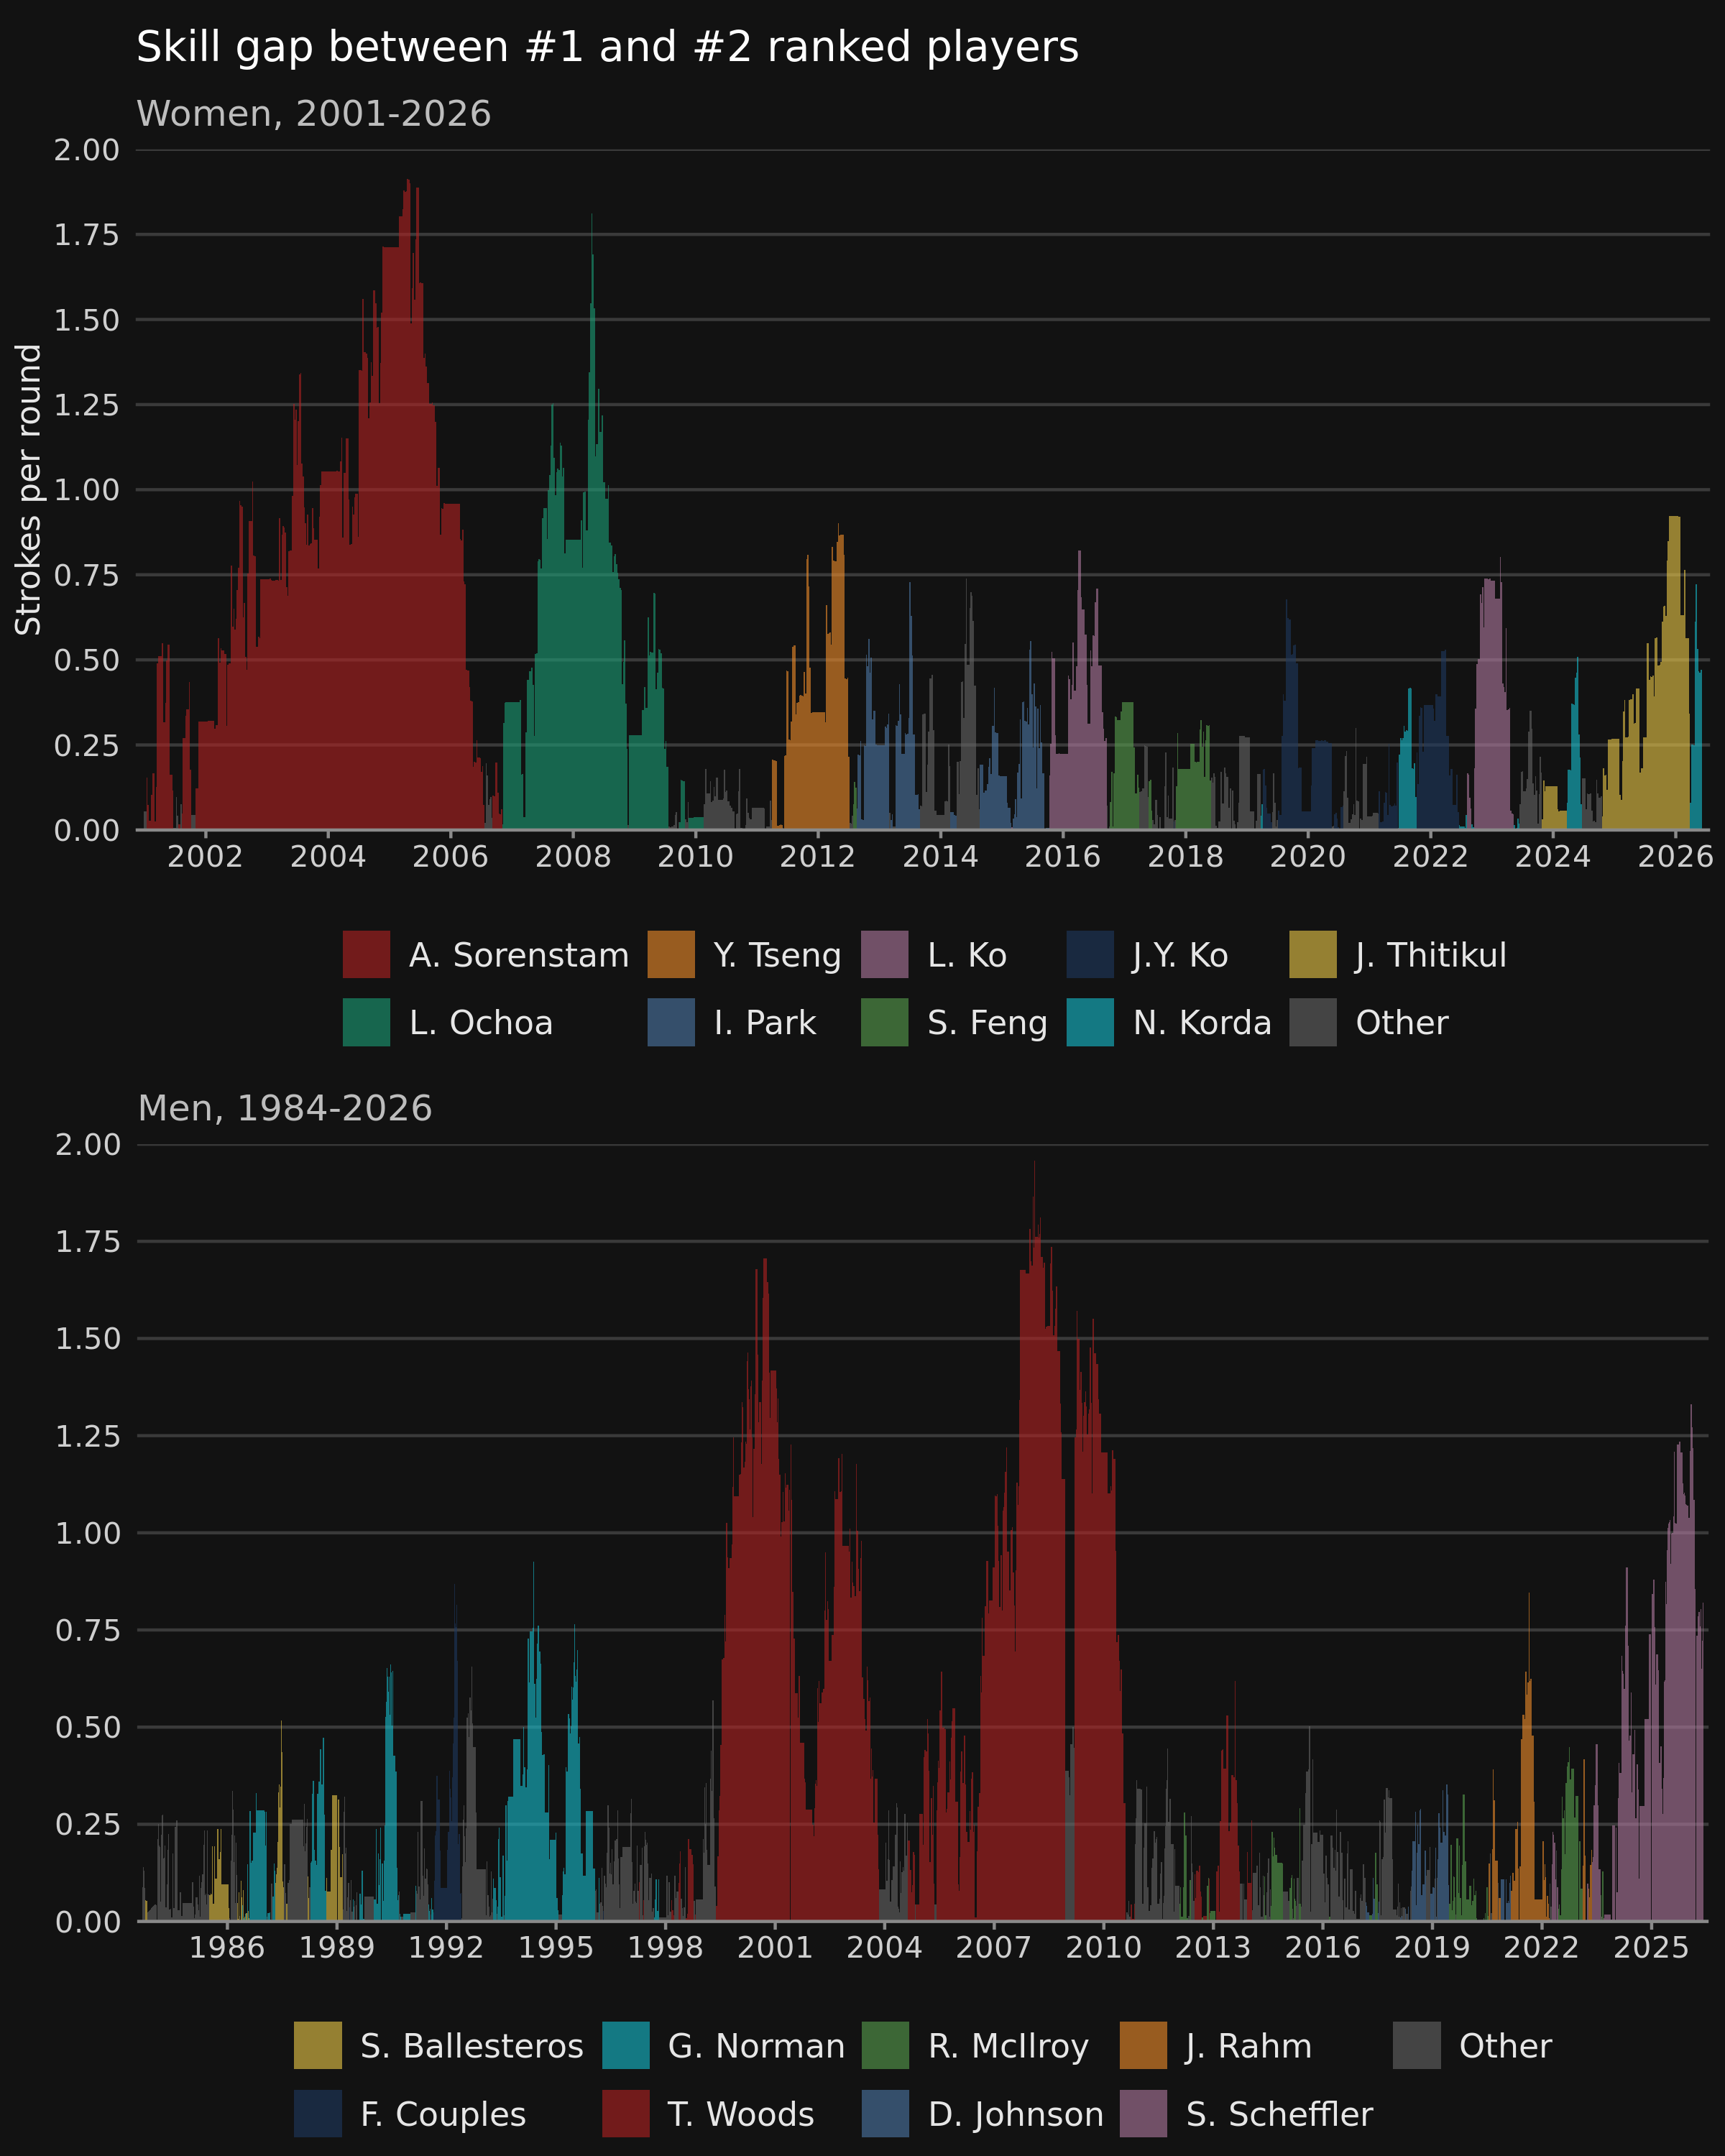 At their best, Sorenstam and Ochoa reached a similar level of dominance over the next-best player to what Tiger
achieved in his prime. However, Tiger sustained his peak for much longer: he was the No. 1 player for almost all of
1999-2010, with a skill level that was on average 0.87 strokes better than
the No. 2 player.
Annika’s peak era lasted about 5.5 years with an average skill gap of 0.9 strokes,
while Ochoa’s lasted three years with an average gap of 0.6 strokes.
At their best, Sorenstam and Ochoa reached a similar level of dominance over the next-best player to what Tiger
achieved in his prime. However, Tiger sustained his peak for much longer: he was the No. 1 player for almost all of
1999-2010, with a skill level that was on average 0.87 strokes better than
the No. 2 player.
Annika’s peak era lasted about 5.5 years with an average skill gap of 0.9 strokes,
while Ochoa’s lasted three years with an average gap of 0.6 strokes.
Returning to the all-time women’s list, here are a few other notable observations:
Readers familiar with our men’s all-time list will know that Tiger’s DG Index peak was "only" +3.9, which he reached at the end of his historic 2000 season. However, the previous section makes clear that comparing Tiger to Sorenstam and Ochoa is not apples-to-apples given how much greater the separation was at the top of the women’s game in the early 2000s. Only three men—Tiger, Scottie, and Norman—have reached a +3 DG Index since 1983, compared to the 19 women that have done it since 2000.
Another way to assess a player’s dominance is to look at their separation from their closest peer. The plots below show the difference in DG index between the #1 and #2 players in our women’s and men’s rankings over time:
Returning to the all-time women’s list, here are a few other notable observations:
- Michelle Wie West’s peak (by DG Index) occurred when she was just 16 years old and less than a year after she turned professional. Despite not winning in this stretch, she had a ridiculous run at the majors (+Evian) in 2005-2006, finishing T2-T3-T3-T5-T3-T2 in a six-event stretch bookended by the ‘05 and ‘06 Evian. These were also basically the only events Wie West played at this time due to the LPGA’s requirement for its members to be at least 18. In general, it’s worth revisiting how ridiculously good her early career was.
- Yani Tseng hit her peak skill of +3.6 in March 2012 at the age of 23. Her game steadily fell off in the following years, with no additional wins and a skill that bottomed out below -3 in 2021. Following a long-term battle with the yips that included multiple extended breaks from the game post-2019, Tseng returned in 2024 putting left-handed. She won on the LET in October 2025, but still sits outside the DG top 200. Tseng’s career is an example of the worst-case simulations we highlighted when projecting Scheffler’s career.
- Jeeno Thitikul’s 2025 season and Nelly Korda’s play this year are more impressive than their positions on the all-time list would suggest. If we restrict the ranking to what might be called the "modern era"—2017 onwards, after the women’s top-5 skill level stabilized around +2—Korda and Thitikul are first and second. They are also the first players to surpass a +3 DG Index since Lydia Ko in April 2016.
Quick Hits
We'll end with some quick takeaways from the women's adjusted SG and rankings data:
- Nelly Korda has begun 2026 with four wins (including two majors), three runner-up finishes, and a T8 in her first eight starts. Her +4.3 SG/round during this stretch ranks 21st among the best 8-event runs since 2000, and the best since 2008. If she were to hold this SG level for the remainder of the season—a big "if"—that would give her the 4th-best season by adjusted SG in our database. In the "modern" era (since 2017), the best season currently belongs to Jeeno Thitikul in 2025, at +3.2.
- Korda won five straight (and 6 of 7) events in 2024, but her wins this year have been more dominant (and the second-place finishes strong enough performances to win most weeks), making this year’s run far more impressive from an SG perspective. Korda averaged "just" +3.7 SG/round during the 2024 run, although that excludes her match play victory.
- The best single round by adjusted SG since 2000 is Lorena Ochoa’s 10-under 62 in round 1 of the 2006 Nabisco Championship (now the Chevron). She gained 12.4 strokes that day, but ultimately went on to lose to Karrie Webb in a playoff.
- The best tournament since 2000 also goes to Ochoa, who gained an adjusted 28.8 strokes at the 2008 HSBC Women’s Champions en route to an 11-stroke victory. The highest adjusted SG total in a major is Cristie Kerr’s 27.7 from her 12-stroke win at the 2010 LPGA Championship.
- Unsurprisingly, seven of the nine best tournaments since 2000 by adjusted SG belong to either Ochoa or Annika. One recent event that deserves special mention is the 2024 Founders Cup, where the top 3 went: Rose Zhang (-24; 16th-best performance since 2000), Madelene Sagstrom (-22), Gabi Ruffels (-9).
- Since 2000, Annika Sorenstam has spent 287 weeks at No. 1 in the DG rankings, almost twice as many as the second-highest total (Lorena Ochoa at 159). Jin Young Ko and Inbee Park are next up at 115 and 114, respectively.
- The consistency queen is Cristie Kerr, who narrowly edges out Sorenstam for the most weeks inside the DG top 10 (477 to 465) despite spending only 10 weeks atop the rankings. Current DG #8 Lydia Ko ranks third at 453 weeks, and Nelly Korda is chasing at 382. Will those two finish their careers atop this list?
- The lowest-DG-Index #1 in our rankings was Hyo Joo Kim at just +1.85 on October 2, 2023. This wasn’t close to her personal peak, however—Kim has exceeded +2 skill in each of the 2014-16, 2020-2023, and 2026 seasons.