Nov 9, 2020
THE MASTERS PREVIEW
A data-driven history of Augusta National
In the last four decades much has changed in the game of golf, but at least one constant has
been Augusta National. Armed with data on (almost) every playing of The Masters since 1983,
we try to shed some light on what it takes to win around the storied Georgia layout.
For this Masters preview, we do three distinct analyses with the aim of deepening our understanding of so-called "course fit" — that is, the degree to which a given golf course favours a specific skill set — at Augusta National. The first section looks at the skill profile of past winners at Augusta National and how it compares to the canonical PGA Tour winner; the second section analyzes hole-level fit at The Masters, and how this has evolved since 1983; the third, and final, section provides an interesting addition to past work we've done on distance and performance in professional golf by analyzing how this relationship has evolved at Augusta National over time.
For this Masters preview, we do three distinct analyses with the aim of deepening our understanding of so-called "course fit" — that is, the degree to which a given golf course favours a specific skill set — at Augusta National. The first section looks at the skill profile of past winners at Augusta National and how it compares to the canonical PGA Tour winner; the second section analyzes hole-level fit at The Masters, and how this has evolved since 1983; the third, and final, section provides an interesting addition to past work we've done on distance and performance in professional golf by analyzing how this relationship has evolved at Augusta National over time.
The winning measurements
Our course fit tool uses the full field
to determine how specific skills, such as driving distance or driving accuracy, are differentially rewarded
at specific courses. Here, we narrow our focus to past winners at Augusta National; while this may be less
useful from a prediction standpoint, we can probably all agree it is at least as interesting.
In the visualization below, we have estimated golfers' skill in each of five attributes — driving distance, driving accuracy, strokes-gained approach, strokes-gained around-the-green, and strokes-gained putting — before each round played since 2004 on the PGA Tour. Each attribute has been normalized to have a mean of 0 and a standard deviation of 1 in each season. For example, at the 2012 Masters, Bubba Watson's value for driving distance was equal to 3.4, indicating that we estimated Watson was 3.4 standard deviations longer than the average PGA Tour player heading into the 2012 Masters. (Recall the 68-95-99.7 rule; if you are 3 SDs above the average in some attribute, that means you are roughly better than 99.85% of the population.) The attribute profile for each Masters winner since 2004 is shown on the plot, in addition to the average profile of all PGA Tour winners since 2004; spend some time clicking around.
How to spot a Masters Champion
2004
 Phil Mickelson
Phil Mickelson
2005
Tiger Woods
Tiger Woods
2006
Phil Mickelson
Phil Mickelson
2007
Zach Johnson
Zach Johnson
2008
 Trevor Immelman
Trevor Immelman
2009
 Angel Cabrera
Angel Cabrera
2010
Phil Mickelson
Phil Mickelson
2011
Charl Schwartzel
Charl Schwartzel
2012
Bubba Watson
Bubba Watson
2013
 Adam Scott
Adam Scott
2014
Bubba Watson
Bubba Watson
2015
Jordan Spieth
Jordan Spieth
2016
 Danny Willett
Danny Willett
2017
 Sergio Garcia
Sergio Garcia
2018
Patrick Reed
Patrick Reed
2019
Tiger Woods
Tiger Woods
Masters Champion Characteristics
Plot Info
SHOW AVG MASTERS WINNER
Avg. PGA TOUR Player
Avg. PGA TOUR Winner
Avg. Masters Champ
2019 Tiger Woods
To wrap up this section, here are the 5 golfers in this year's field that most closely match the average skill profile of past Masters champions (in order of similarity): Patrick Cantlay, Dustin Johnson, Xander Schauffele, Adam Scott, and Justin Thomas. Interestingly, both our clear Masters favourite in Jon Rahm, as well as the betting market's favourite in Bryson DeChambeau, are missing from this list.
Digging deeper: hole-level fit
Now that we have some idea of which types of players tend to succeed at The Masters,
let's break it down further. The table below shows the expected increase in strokes-gained
from improving one standard deviation (SD) in driving distance, and (separately) from improving one SD
in driving accuracy, for each hole at Augusta National. The data used spans the 1983-2019
editions of The Masters. As detailed above, we have estimates for golfers' skill in each attribute
at each point in time; the values in the table are then obtained by
correlating strokes-gained at the hole level with a golfer's
attributes. Importantly, these estimates are conditional on the golfer's
other attributes.
To put it simply, we try to answer the question: if Phil Mickelson improves his driving distance by 1 standard
deviation — roughly 8.3 yards on the 2020 PGA Tour —
while the rest of his skill set remains as is (difficult to
imagine, we know!),
how much would we expect his strokes-gained to improve on each hole?
For reference, at a randomly selected hole on the PGA Tour from 1983-2019, the benefit of a 1 SD increase in distance was roughly 0.025 strokes, while for accuracy it was 0.02 strokes. To view how the hole-specific estimates have changed over time, click a row and an evolution plot will expand. The final two columns list the golfers in this year's Masters field who stand to benefit the most, and least, from each hole's respective "fit" — if you've followed Weir's shot tracker over the past few years, it shouldn't come as a surprise that Hole 2 doesn't exactly suit his game.
Which holes, which skills?
SG INCREASE FROM 1 SD IMPROVEMENT IN:
WHO BENEFITS?
There is a lot to digest from this table, here are our main takeaways:
1) As expected, the par 5s at Augusta National provide the greatest advantage to golfers with length, and Hole 15 tops the list.
2) Hole 9 is the par 4 with the largest reward for distance; in fact, if we restrict our attention to the last 10 years, the 9th hole provides the largest distance advantage of any hole. This was surprising, but makes sense given the trees on either side of the fairway end abruptly at the bottom of the hill, making it critical to either drive it past them, or be in the fairway further back.
3) Hole 3 — despite being drivable — does not seem to favour players with more distance (or accuracy). The low value for both attributes appears to be due to the fact that, historically, Hole 3 has had low variance in scores. One possible explanation for this is that the green and surrounding runoffs are so treacherous that players are frequently forced to play away from the hole, increasing the likelihood of pars.
4) While driving accuracy is in general rewarded less at Augusta National than at other PGA Tour venues, it does earn above-average returns on Holes 2, 10, and 7.
5) Since 1983, Holes 9, 13, and 18 have seen the largest increases in the advantage they give to longer golfers.
Finally, a few points of clarification. We restrict our attention to the effects of driving distance and accuracy over the full time period because the strokes-gained categories are only available after 2004; if both driving accuracy and driving distance have low value on a given hole, this just means that skill (to the degree that driving distance and accuracy measure it) is not rewarded on that hole; a negative estimate in an individual year can arise simply due to statistical noise: sometimes lower-skilled golfers beat higher-skilled golfers!
Distance or accuracy? Taking the long view
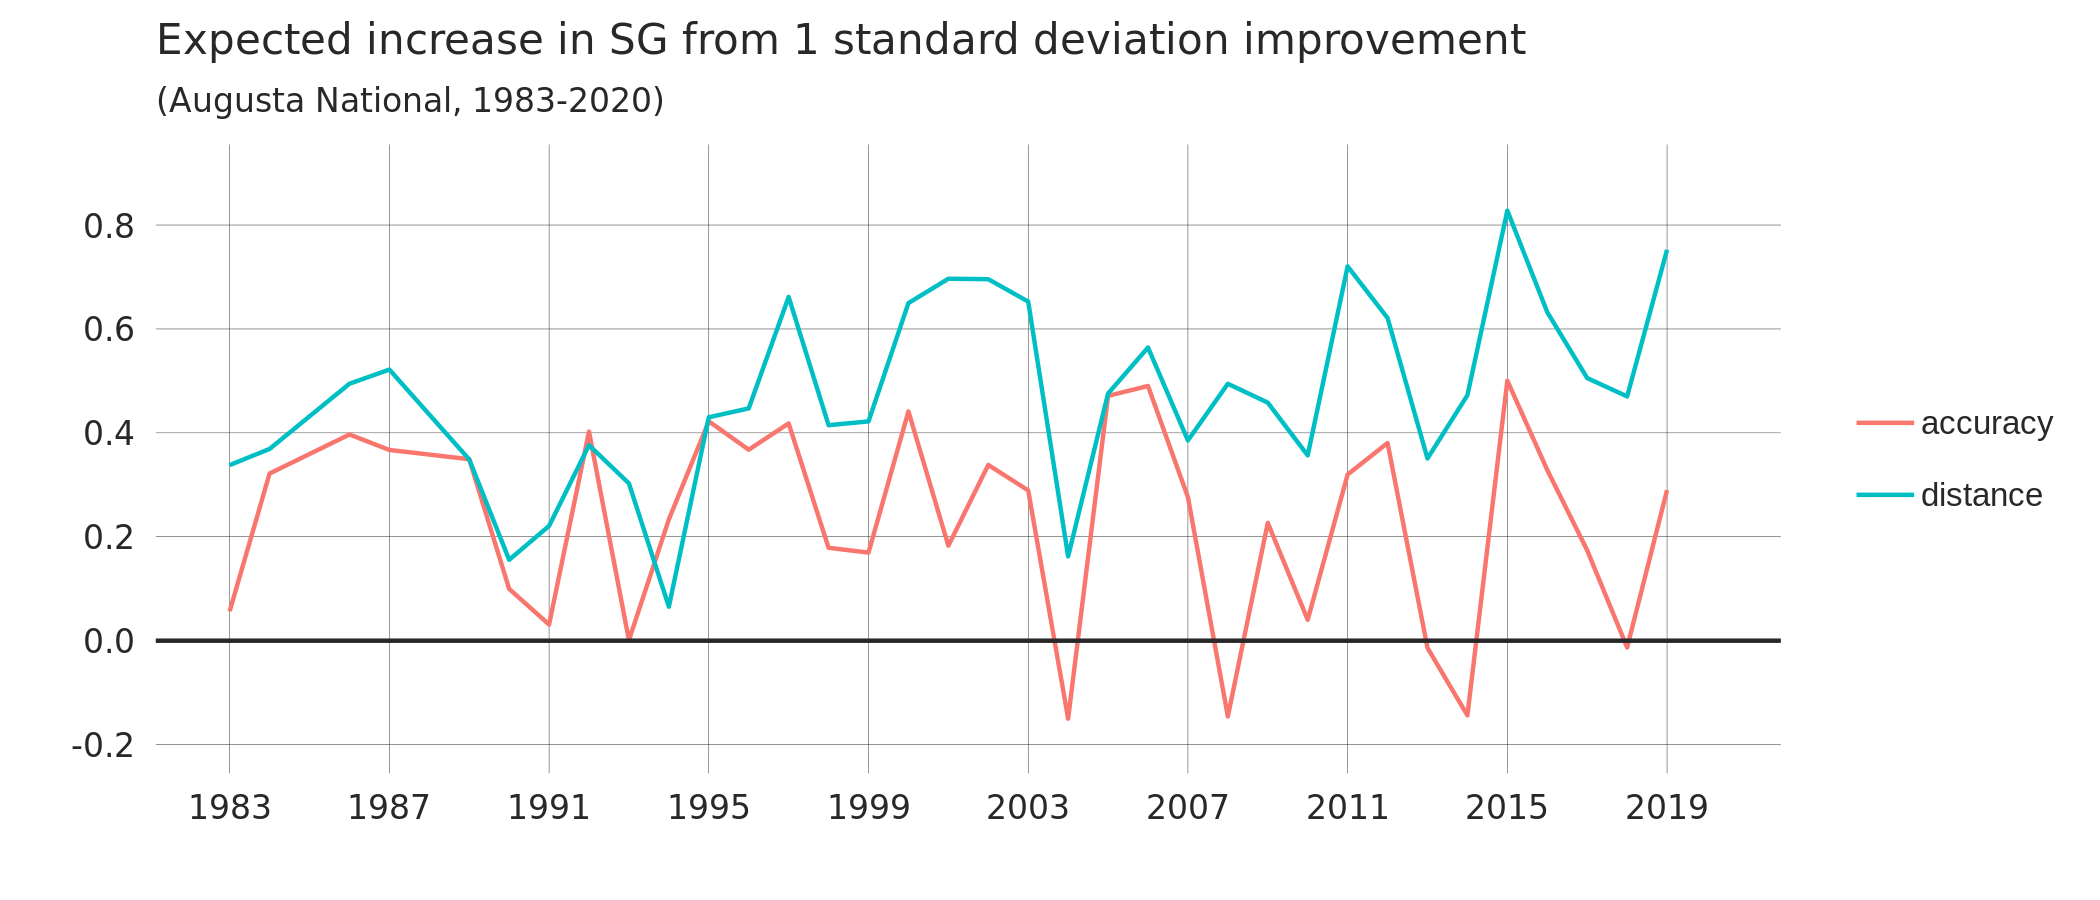
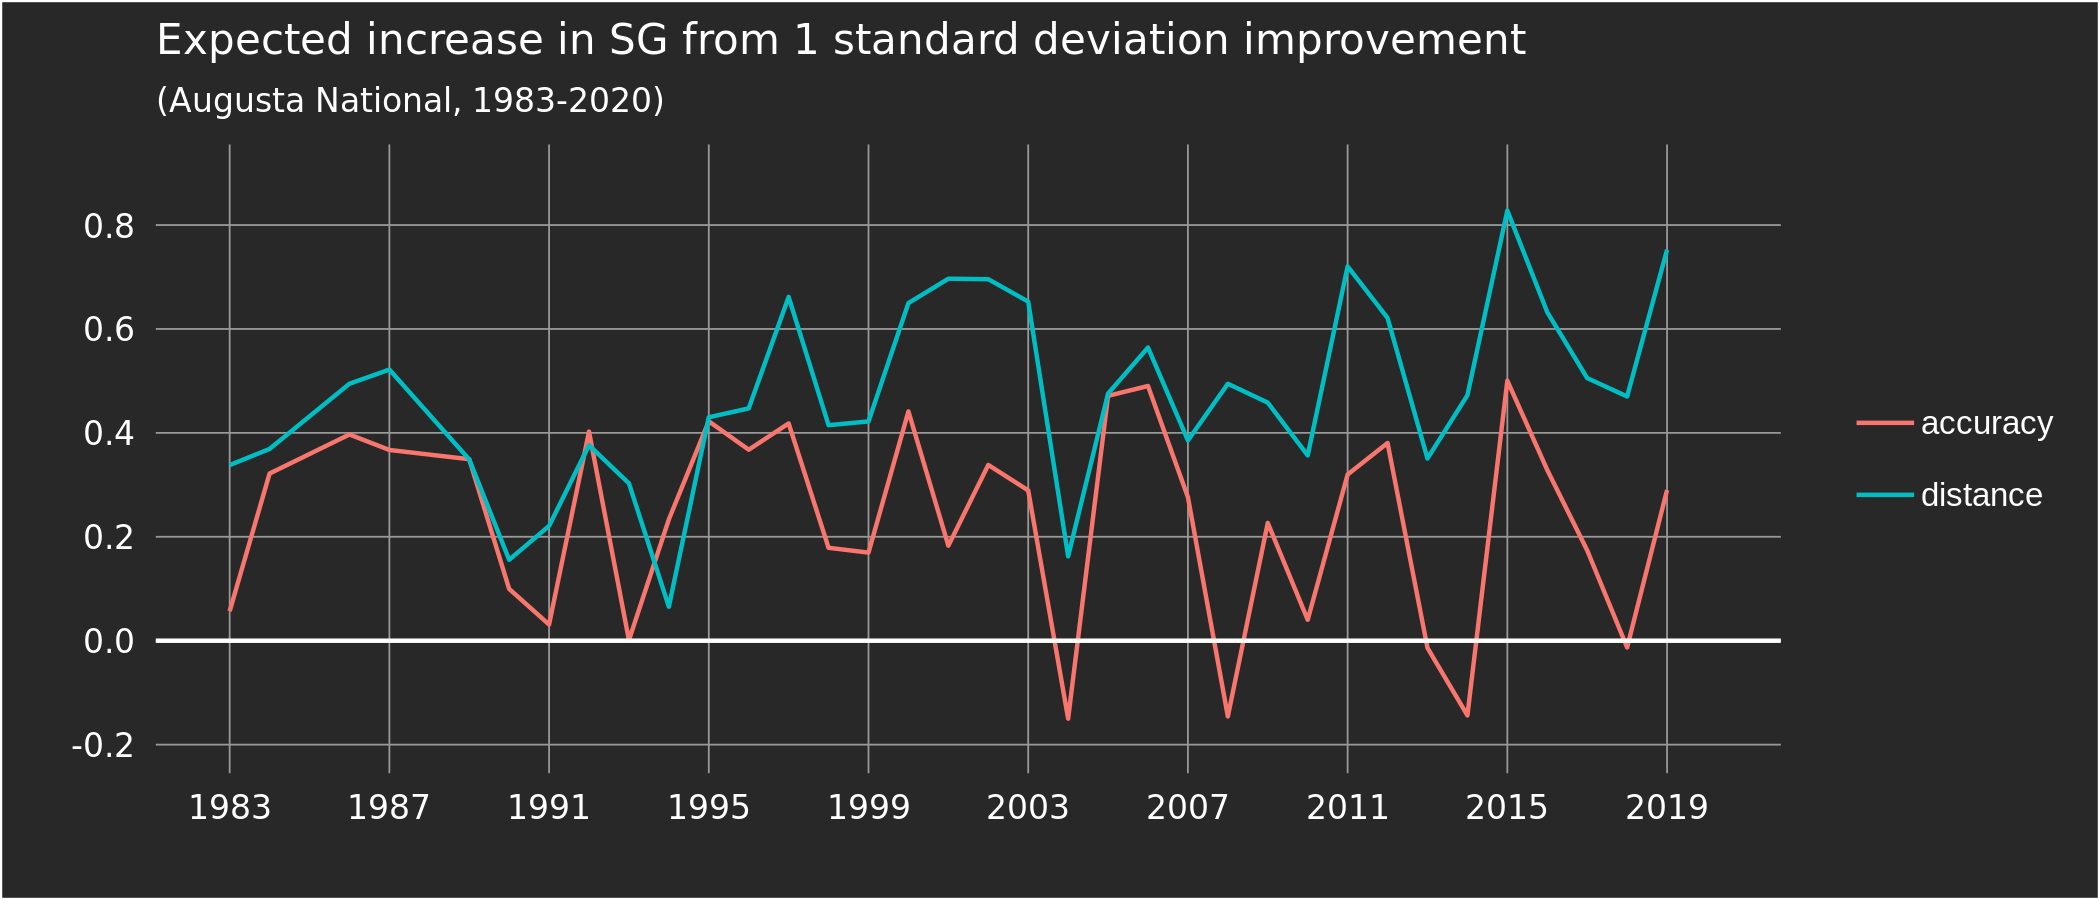
In this final section, we take a step back from our hole-level analysis to understand
how the overall relationship between distance, accuracy, and performance has evolved
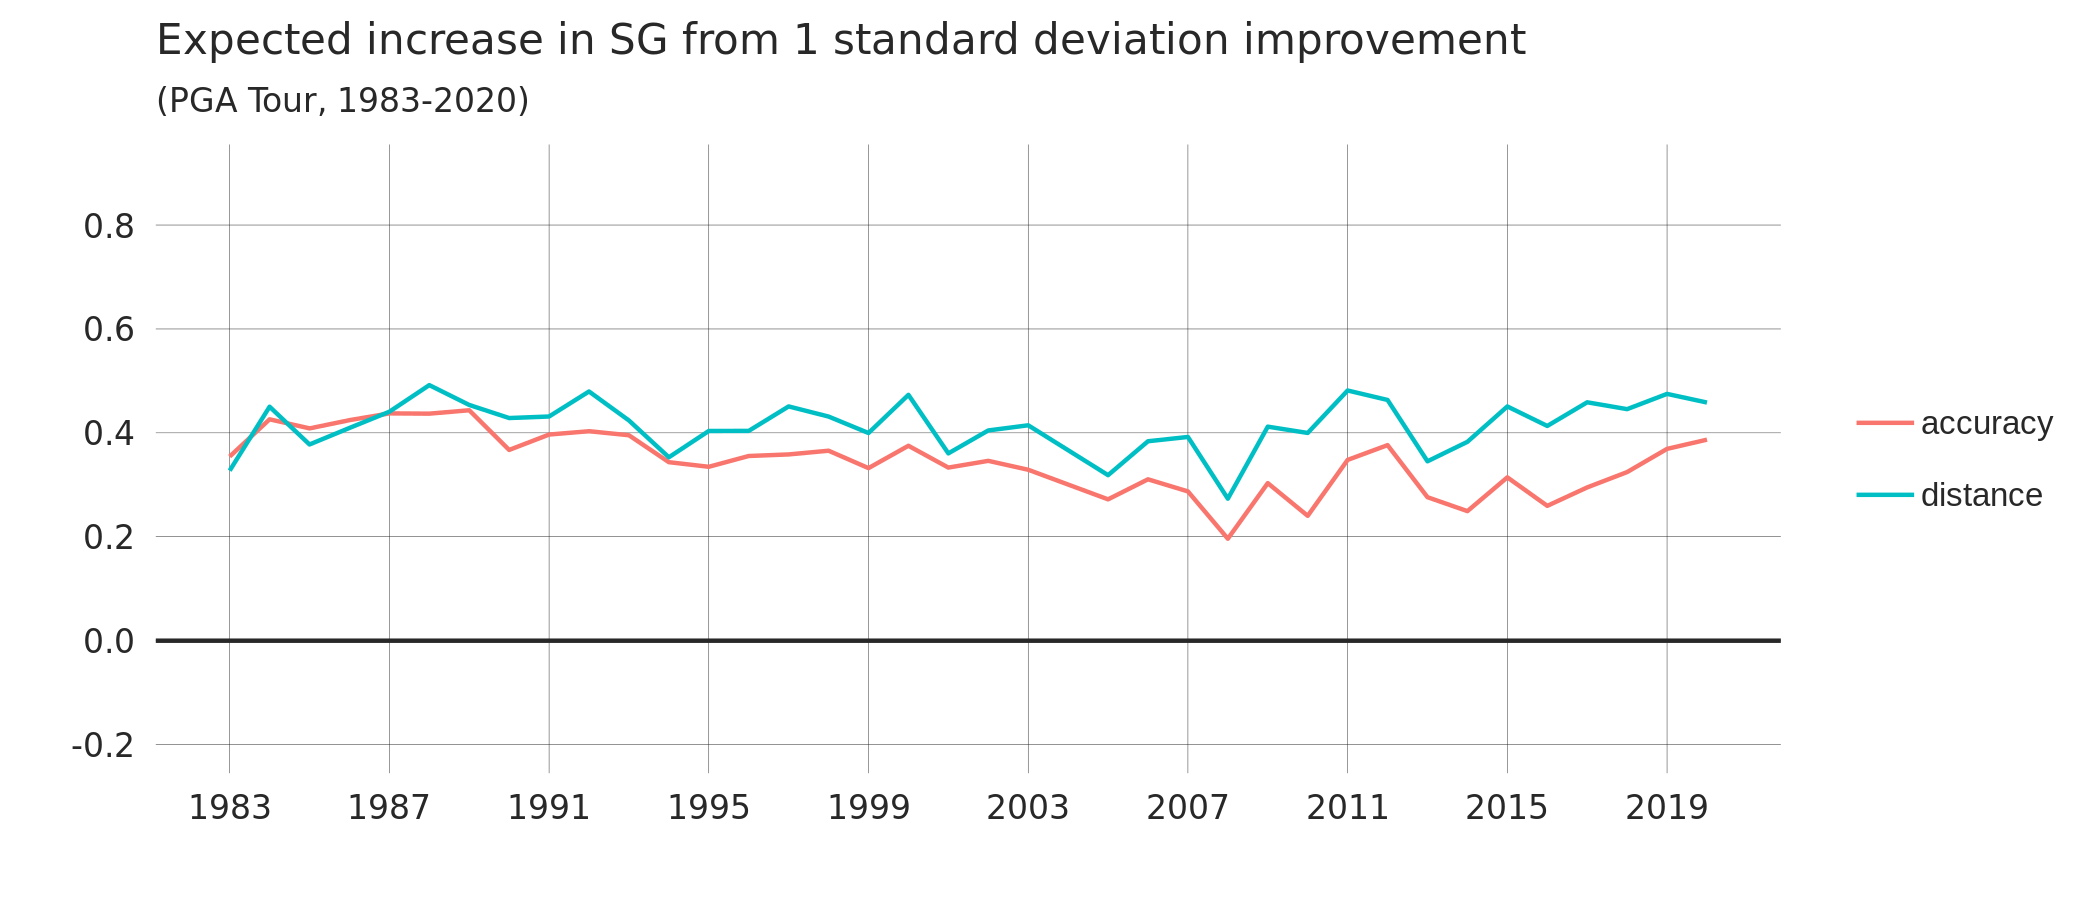
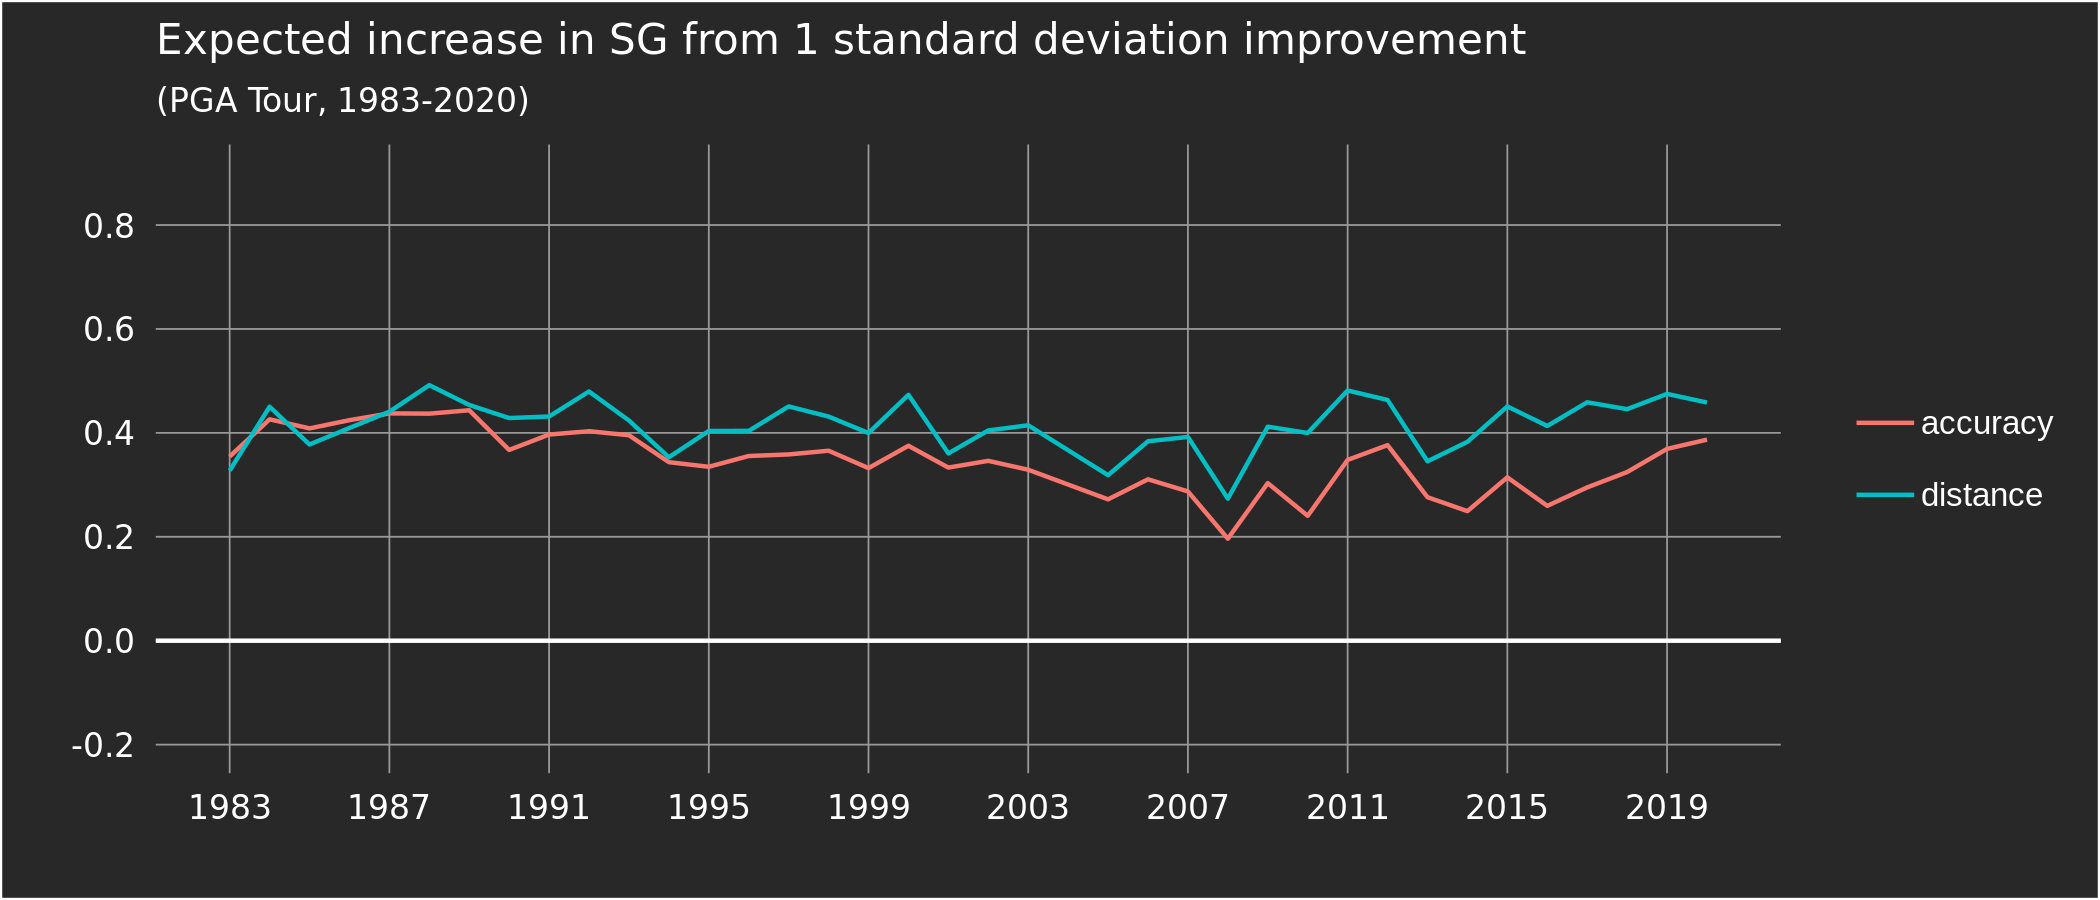
at Augusta National over the last four decades. Before focusing on Augusta however, let's look at the
relationship using data from all
PGA Tour events.
As with the hole-level analysis, the focus here is on the expected increase in total strokes-gained from improving driving distance, or driving accuracy, by 1 standard deviation. Further, as above, these estimates attempt — through regression analysis — to hold constant, or control for, the effects of the other attributes. For example, the data point for driving distance in 2015 in the plot below tells us the following: if a golfer increases their driving distance by 1 standard deviation (which equalled ~8.4 yards in 2015), then they can expect their total strokes-gained to increase by ~0.45 strokes per round. The key here is that driving accuracy, strokes-gained approach, etc, are held constant. Similarly, the accuracy data point for 2015 tells us the expected increase in strokes-gained from improving driving accuracy by 1 SD (~4.4% in 2015), while holding constant driving distance, etc. For the years before 2004, where the strokes-gained categories were not available, we can only control for driving accuracy when estimating the distance effect (and vice versa), but by assuming the correlation structure between the five attributes remained constant over time (a tenuous assumption), we can make the pre-2004 and post-2004 estimates comparable.
As promised, the next plot displays results from an identical analysis to the one described above, except only using data from Augusta National. Due to the smaller sample size, there is much more variation in the yearly estimates; despite the noise, some clear patterns emerge. Averaging over the entirety of the sample, the advantage of distance is larger at Augusta National than at the average PGA Tour event; this has been increasing over time, with the recent distance advantage hovering around 0.6 strokes (compared to the PGA Tour average of ~0.45). For driving accuracy, there is no clear trend, with accuracy being rewarded less at Augusta National than other PGA Tour venues for the duration of the time period.