Septemer 21, 2021
How much is 10 yards worth?
— Estimating the advantage of driving distance as a function of hole length
While playing a round of golf the other day, it occurred to me that gaining 10 yards over
the field average on a given tee shot is not always worth the same number of strokes. For example,
the difference between a tee shot that ends up 220 yards from the green versus 230 yards is about 0.06 strokes,
while the difference between a tee shot that ends up 120 yards from the greens versus 130 yards is just 0.03 strokes.
This is not a novel insight (and I hope for my own sake that I did already have this knowledge in my brain somewhere),
but it was an interesting realization that ties in closely with some of the work we've been doing recently.
In the last month or so we've started down the long path towards a shot-level model. With this model the goal is to predict the probability of holing out in a discrete number of strokes (1, 2, 3, 4, etc) from any location on the golf course. As with our current round-level model, the specific skill set of the golfer hitting the shot is an important consideration: their driving distance, accuracy, approach skill, etc. Further, it's clear that the benefit of each skill should vary depending on the characteristics of the shot. In this post, we are going to focus on a particular skill and a particular shot characteristic: namely, how the advantage of driving distance varies as a function of the length of the hole.
As a starting point, let's look at the expected strokes to hole out as a function of the distance to the pin for approach shots. The plot below shows this separately for shots from the fairway (or intermediate rough) and for shots from the primary rough.
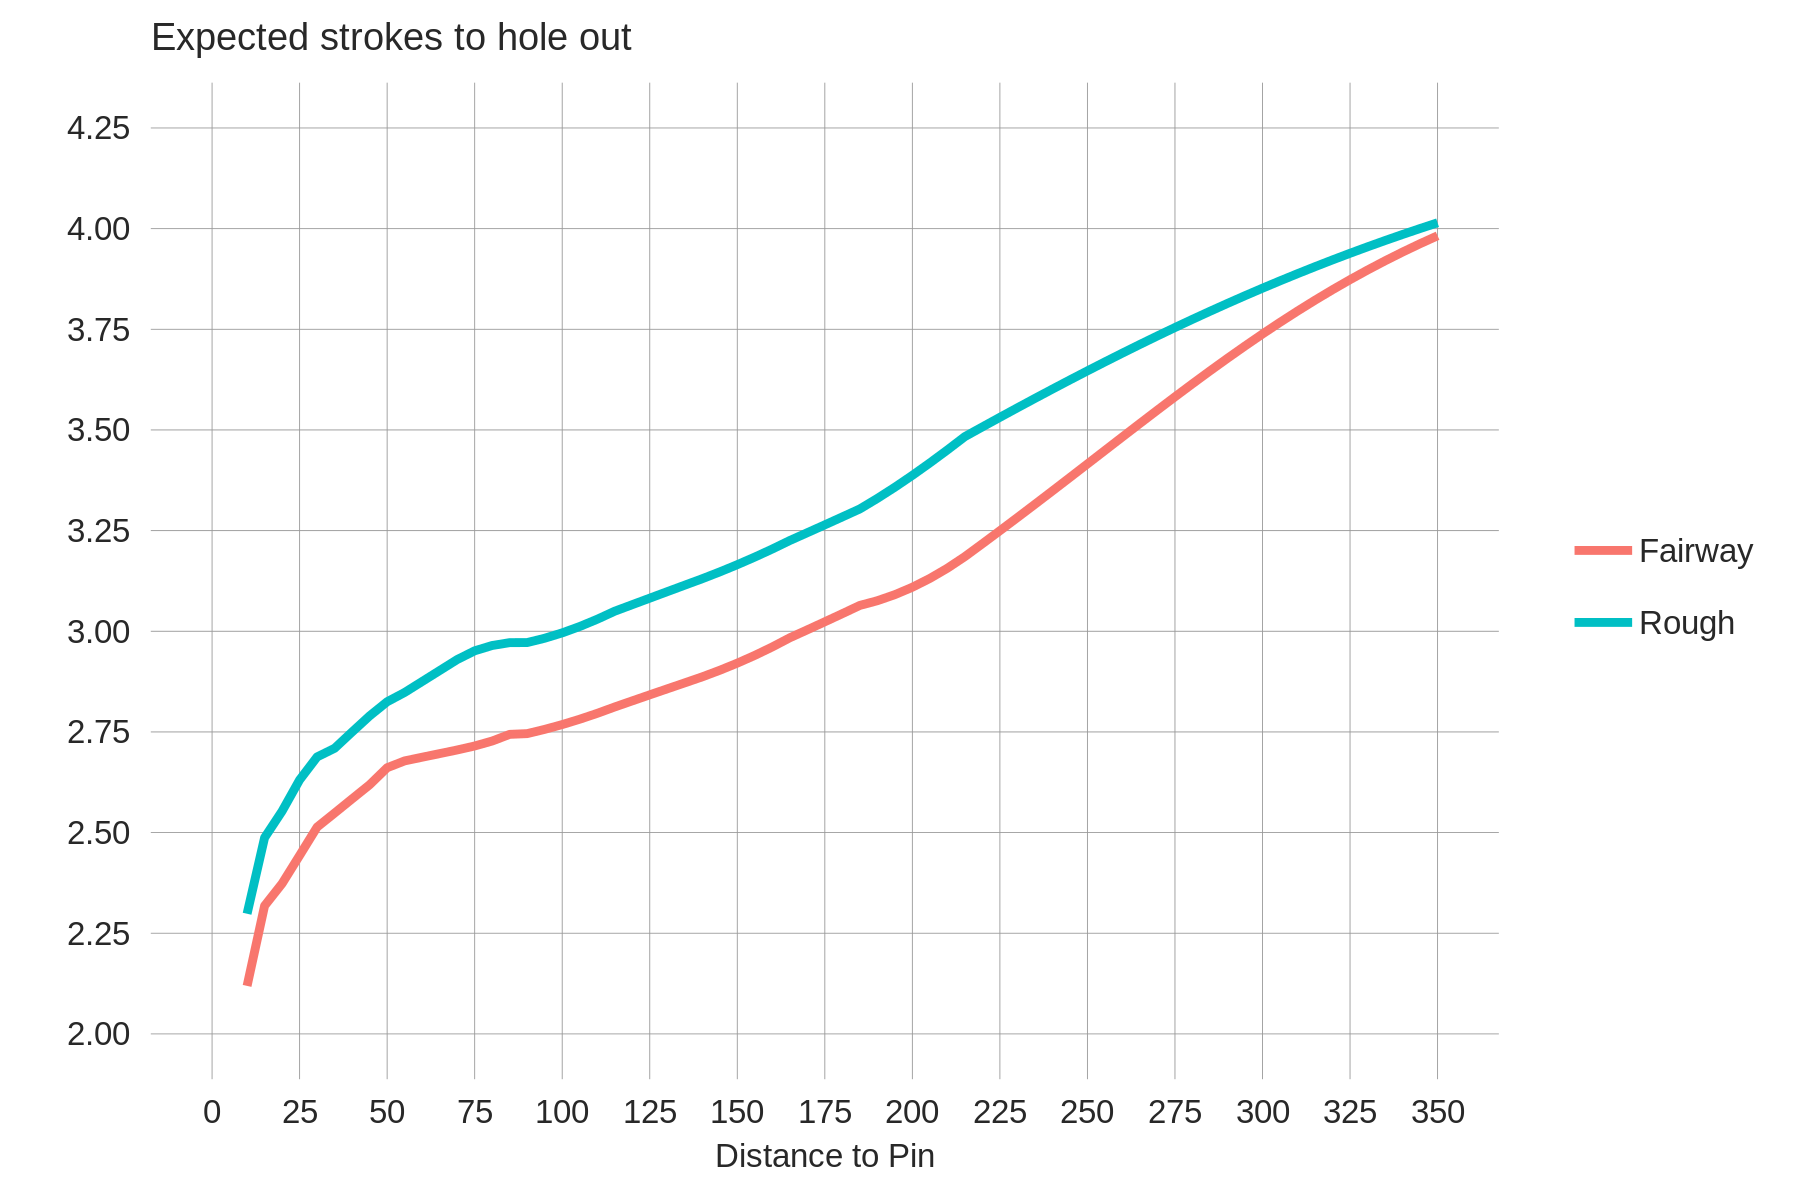
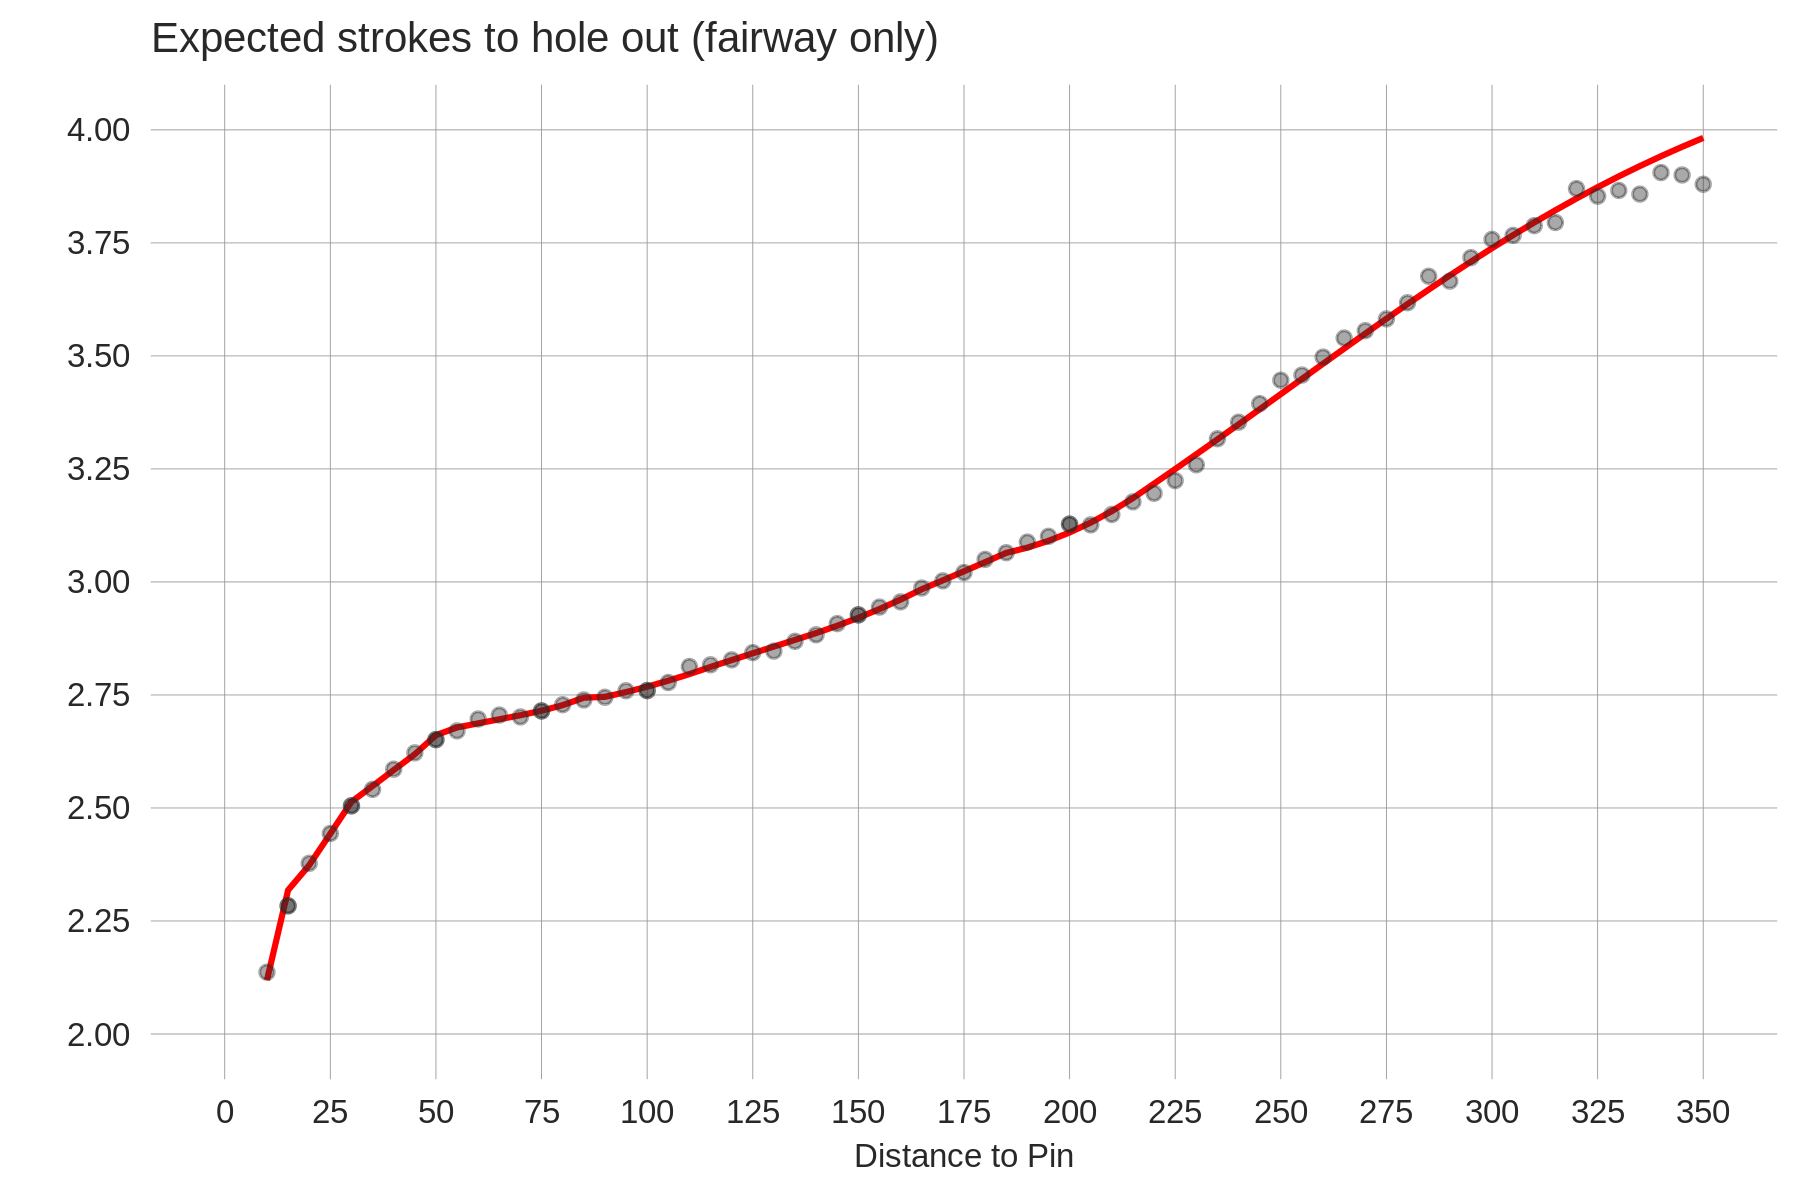
If you are familiar with how the PGA Tour calculates strokes-gained, you'll know that these curves are called baseline functions. The creator of strokes-gained, Mark Broadie, plots these same functions (using different data) in one of the original strokes-gained papers. The lines are smooth because a statistical model has been fit to the raw data. Shown below is the fairway curve from above along with the average strokes to hole out in 5-yard increments (e.g. the value at 100 yards is the stroke average for all fairway shots between 97.5 and 102.5 yards from the pin). There aren't many data points beyond 325 yards so I wouldn't put a lot of trust in that section of the plot — we likely just need to add a few more years of data (this uses the 2018-2021 PGA Tour seasons).
What do these curves tell us about which holes we should expect to give a greater or lesser advantage to players who hit it far? The slope of the baseline function varies considerably as we move from 25 out to 350 yards from the green. For example, it's steeper between 200-250 yards than it is between 100-150 yards. This means that 10 extra yards off the tee will be "worth more" if it moves a player from a 230 yard approach shot to a 220 yard one than if it moves a player from 130 to 120. This is the explanation behind my epiphany in the introduction. A 310 yard drive on a 530 yard hole will gain more strokes than that same 310 yard drive on a 430 yard hole. This is interesting in part because it demonstrates how strokes-gained is an imperfect measure of the quality of golf shots.1
To complete this thought, the next plot shows the benefit (i.e. the decrease in expected strokes to hole out) from moving 10 yards closer to the green as a function of the distance to the pin. For example, the value at 210 yards is equal to the expected strokes to hole out from 210 yards (3.156) minus the expected strokes to hole out from 200 yards (3.109). For this calcuation the fairway baseline function is used.
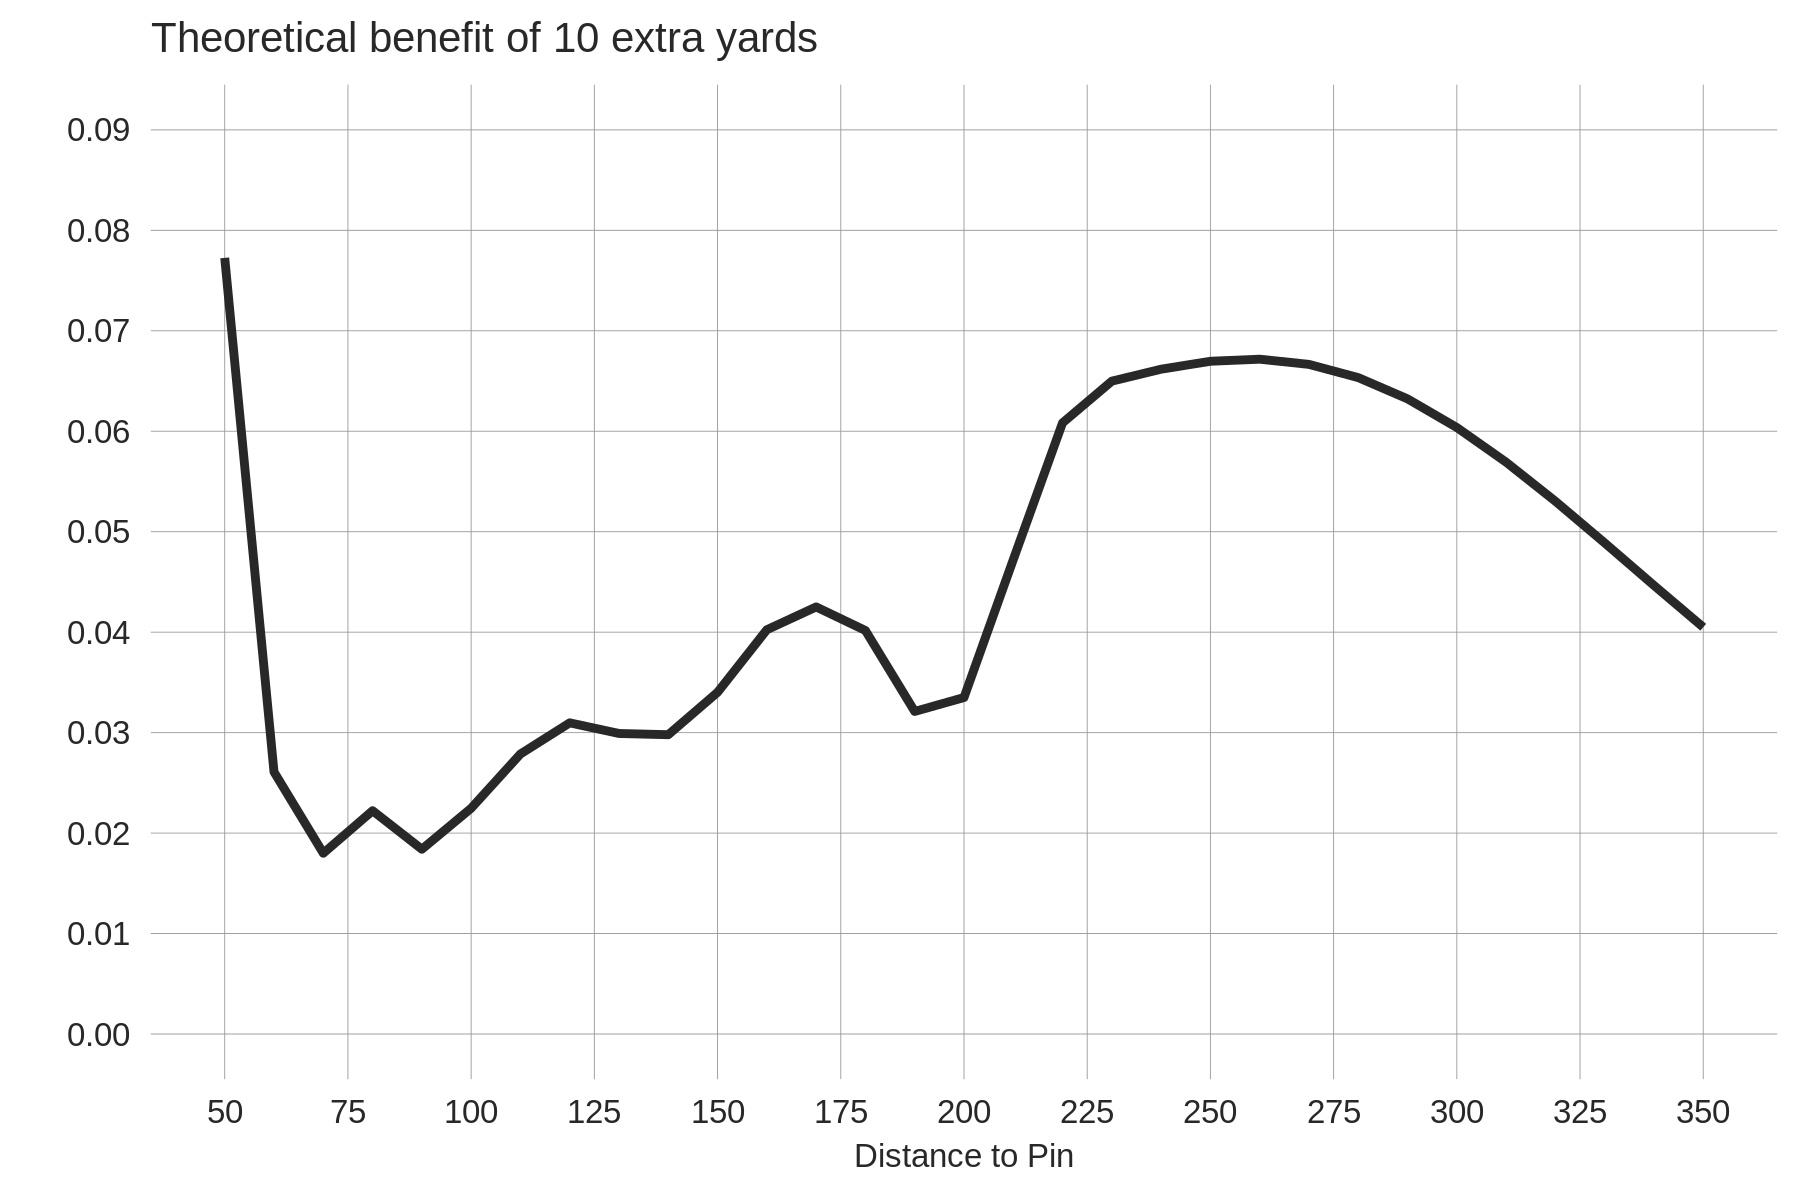
Assuming an average tee shot length of 300 yards, the above calculation can potentially be interpreted as a prediction of the advantage of 10 extra yards on hole lengths ranging from 350 yards to 650 yards. That is, if golfer A is on average 10 yards longer than golfer B, this plot traces out A's advantage over B as the length of the hole changes. This is a theoretical prediction of sorts, so it's useful to spell out exactly what assumptions are built into it. First, for this interpretation to be valid, we must assume that A and B are equally skilled at holing out after their tee shots. This assumption comes from the fact that the same baseline function is used to predict expected strokes to hole out from each approach distance. Second, we require that A and B are equally accurate off the tee. This allows for only the baseline function for fairway shots to be used in the calculation. Technically the rough baseline function should be used as well, but because the slopes are roughly the same (see the first plot) it won't make much difference. Third, this interpretation requires that the longer golfer hits their drives 10 yards further (on average) regardless of the length of the hole. I like this type of exercise because it makes clear the assumptions built into an answer to the question of "how much is 10 yards of distance worth?". Further, it provides a useful benchmark to compare our actual empirical estimates to.
To estimate the advantage of 10 yards of distance directly from the data, player skills are added to the model that was used to generate the baseline functions above. (Except now we are estimating the expected strokes to hole out from the tee instead of for approach shots.) We include our usual 5 attributes: distance, accuracy, approach, around-the-green, and putting. These player skills are allowed to interact with distance from the pin: that is, the benefit of driving distance can change depending how far a golfer is from the pin. The plot below shows the estimated 10-yard distance advantage as a function of hole length. For example, the value at 375 yards tells us the expected scoring differential on a 375 yard hole between two golfers who are of equal skill except one hits it 10 yards further than the other.
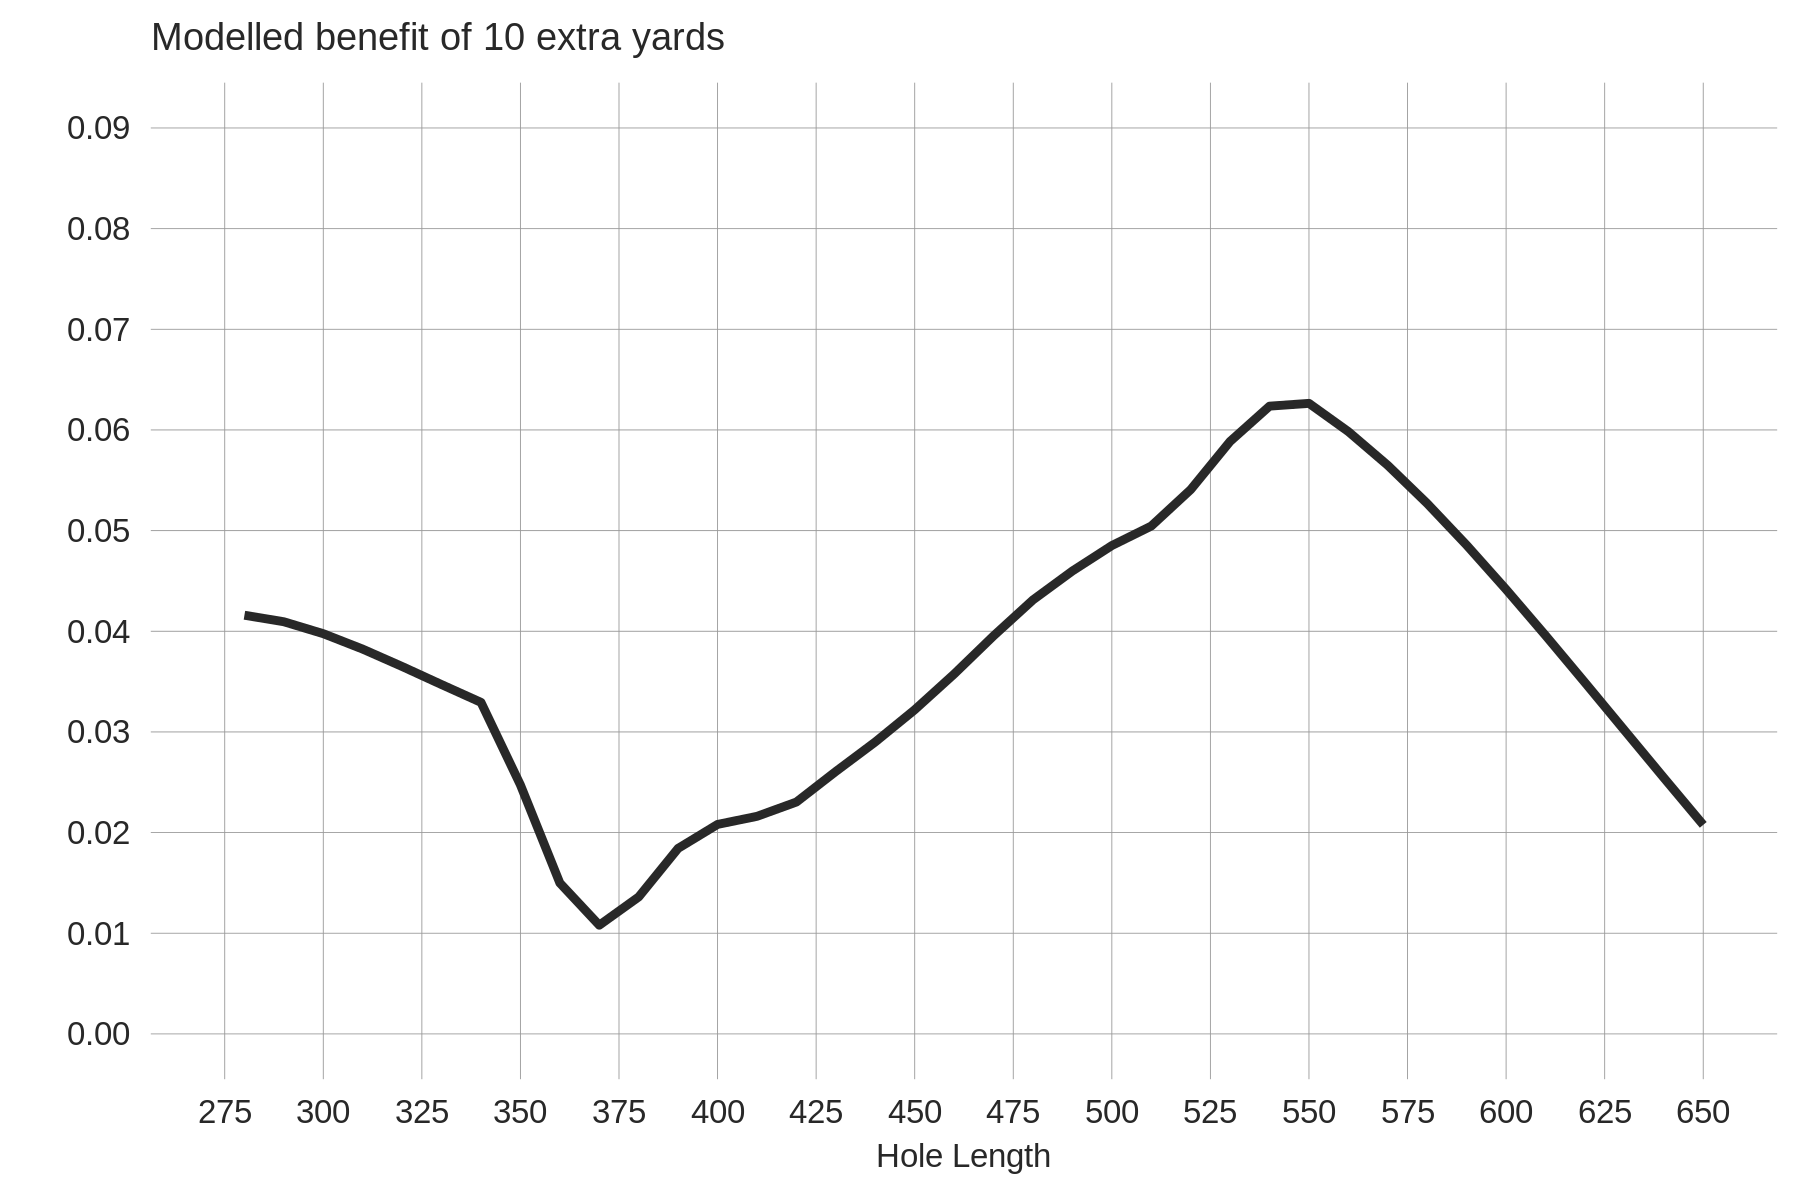
The modelled estimates match up pretty closely with the theoretical predictions. For shorter holes, we don't estimate a distance advantage as large as what was predicted by our earlier calculations. Still, I was impressed that our results made as much intuitive sense as they do. The least-advantageous hole length for bombers is between 360-400 yards; these are holes that aren't quite driveable and the average drive is landing in a location where a few more yards doesn't make as much difference as other distances. As hole length extends beyond 600 yards the distance advantage also declines, presumably because these holes are three-shotters for even the longest players. For holes shorter than 350 yards, the framework outlined above is probably too simplistic. For example, the assumptions behind our calculation required that a longer player playing a 350 yard hole hits it to 40 yards from the green instead of the field average of 50 yards. However on many of these holes it's likely that most players aren't hitting driver, either due to a more severe penalty for a missed fairway or the lack of a fairway altogether in the 300 yard landing zone. To properly capture the advantage of distance on these holes, more hole features will need to be modelled. For a final common-sense check of these estimates, averaging the distance advantages by hole length (taking into account the frequency with which each hole length is played) yields an advantage of approximately 0.035 strokes per hole. Multiplying this by 14 (the typical number of non-par-3 holes in a round) gives 0.5 strokes per round, which is in the neighbourhood of our previous estimates of the benefit of 10 yards of driving distance at the round level.
In the last month or so we've started down the long path towards a shot-level model. With this model the goal is to predict the probability of holing out in a discrete number of strokes (1, 2, 3, 4, etc) from any location on the golf course. As with our current round-level model, the specific skill set of the golfer hitting the shot is an important consideration: their driving distance, accuracy, approach skill, etc. Further, it's clear that the benefit of each skill should vary depending on the characteristics of the shot. In this post, we are going to focus on a particular skill and a particular shot characteristic: namely, how the advantage of driving distance varies as a function of the length of the hole.
As a starting point, let's look at the expected strokes to hole out as a function of the distance to the pin for approach shots. The plot below shows this separately for shots from the fairway (or intermediate rough) and for shots from the primary rough.
If you are familiar with how the PGA Tour calculates strokes-gained, you'll know that these curves are called baseline functions. The creator of strokes-gained, Mark Broadie, plots these same functions (using different data) in one of the original strokes-gained papers. The lines are smooth because a statistical model has been fit to the raw data. Shown below is the fairway curve from above along with the average strokes to hole out in 5-yard increments (e.g. the value at 100 yards is the stroke average for all fairway shots between 97.5 and 102.5 yards from the pin). There aren't many data points beyond 325 yards so I wouldn't put a lot of trust in that section of the plot — we likely just need to add a few more years of data (this uses the 2018-2021 PGA Tour seasons).
What do these curves tell us about which holes we should expect to give a greater or lesser advantage to players who hit it far? The slope of the baseline function varies considerably as we move from 25 out to 350 yards from the green. For example, it's steeper between 200-250 yards than it is between 100-150 yards. This means that 10 extra yards off the tee will be "worth more" if it moves a player from a 230 yard approach shot to a 220 yard one than if it moves a player from 130 to 120. This is the explanation behind my epiphany in the introduction. A 310 yard drive on a 530 yard hole will gain more strokes than that same 310 yard drive on a 430 yard hole. This is interesting in part because it demonstrates how strokes-gained is an imperfect measure of the quality of golf shots.1
To complete this thought, the next plot shows the benefit (i.e. the decrease in expected strokes to hole out) from moving 10 yards closer to the green as a function of the distance to the pin. For example, the value at 210 yards is equal to the expected strokes to hole out from 210 yards (3.156) minus the expected strokes to hole out from 200 yards (3.109). For this calcuation the fairway baseline function is used.
Assuming an average tee shot length of 300 yards, the above calculation can potentially be interpreted as a prediction of the advantage of 10 extra yards on hole lengths ranging from 350 yards to 650 yards. That is, if golfer A is on average 10 yards longer than golfer B, this plot traces out A's advantage over B as the length of the hole changes. This is a theoretical prediction of sorts, so it's useful to spell out exactly what assumptions are built into it. First, for this interpretation to be valid, we must assume that A and B are equally skilled at holing out after their tee shots. This assumption comes from the fact that the same baseline function is used to predict expected strokes to hole out from each approach distance. Second, we require that A and B are equally accurate off the tee. This allows for only the baseline function for fairway shots to be used in the calculation. Technically the rough baseline function should be used as well, but because the slopes are roughly the same (see the first plot) it won't make much difference. Third, this interpretation requires that the longer golfer hits their drives 10 yards further (on average) regardless of the length of the hole. I like this type of exercise because it makes clear the assumptions built into an answer to the question of "how much is 10 yards of distance worth?". Further, it provides a useful benchmark to compare our actual empirical estimates to.
To estimate the advantage of 10 yards of distance directly from the data, player skills are added to the model that was used to generate the baseline functions above. (Except now we are estimating the expected strokes to hole out from the tee instead of for approach shots.) We include our usual 5 attributes: distance, accuracy, approach, around-the-green, and putting. These player skills are allowed to interact with distance from the pin: that is, the benefit of driving distance can change depending how far a golfer is from the pin. The plot below shows the estimated 10-yard distance advantage as a function of hole length. For example, the value at 375 yards tells us the expected scoring differential on a 375 yard hole between two golfers who are of equal skill except one hits it 10 yards further than the other.
The modelled estimates match up pretty closely with the theoretical predictions. For shorter holes, we don't estimate a distance advantage as large as what was predicted by our earlier calculations. Still, I was impressed that our results made as much intuitive sense as they do. The least-advantageous hole length for bombers is between 360-400 yards; these are holes that aren't quite driveable and the average drive is landing in a location where a few more yards doesn't make as much difference as other distances. As hole length extends beyond 600 yards the distance advantage also declines, presumably because these holes are three-shotters for even the longest players. For holes shorter than 350 yards, the framework outlined above is probably too simplistic. For example, the assumptions behind our calculation required that a longer player playing a 350 yard hole hits it to 40 yards from the green instead of the field average of 50 yards. However on many of these holes it's likely that most players aren't hitting driver, either due to a more severe penalty for a missed fairway or the lack of a fairway altogether in the 300 yard landing zone. To properly capture the advantage of distance on these holes, more hole features will need to be modelled. For a final common-sense check of these estimates, averaging the distance advantages by hole length (taking into account the frequency with which each hole length is played) yields an advantage of approximately 0.035 strokes per hole. Multiplying this by 14 (the typical number of non-par-3 holes in a round) gives 0.5 strokes per round, which is in the neighbourhood of our previous estimates of the benefit of 10 yards of driving distance at the round level.