• DG Betting Blog
For those of you familiar with our work, you know we have spent considerable time discussing the inherent randomness in golf scores. Because of this characteristic, it is hard to find information that is useful in predicting the outcome of tournaments. Although that’s not to say efforts have not been made, as many tipsters and podcast hosts cite an abundance of golf statistics (course history, turf splits, par 3 performance, the list goes on) in their betting or fantasy previews for upcoming tournaments. While these stats may be interesting, the reality is they are not of much use when it comes to predicting.
This generally leads us to offer the advice of staying away from granular statistics. However, while our model’s predictions are mainly driven by field-strength adjusted scores, we have also found it helpful to incorporate performance in the individual strokes-gained categories: off-the-tee (OTT), approach (APP), around-the green (ARG), and putting (PUTT). What this means is that additional predictive information can be gleaned from how a player is shooting their scores.
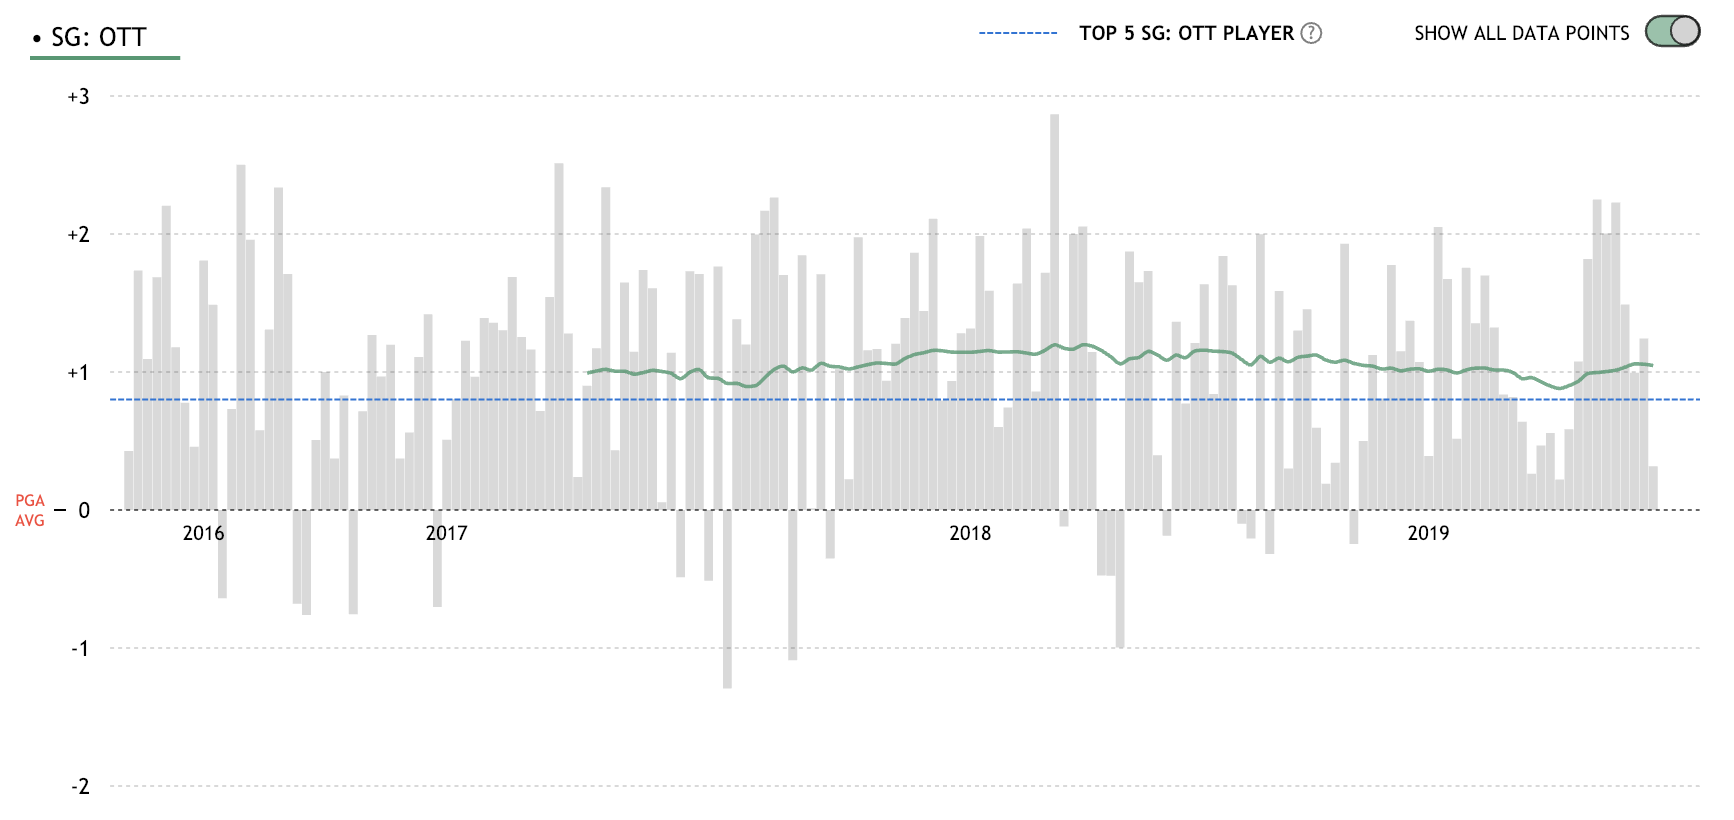
To get a sense of why this is the case, consider this plot of Jon Rahm’s strokes-gained off-the-tee (SG:OTT) for every round of his young career:
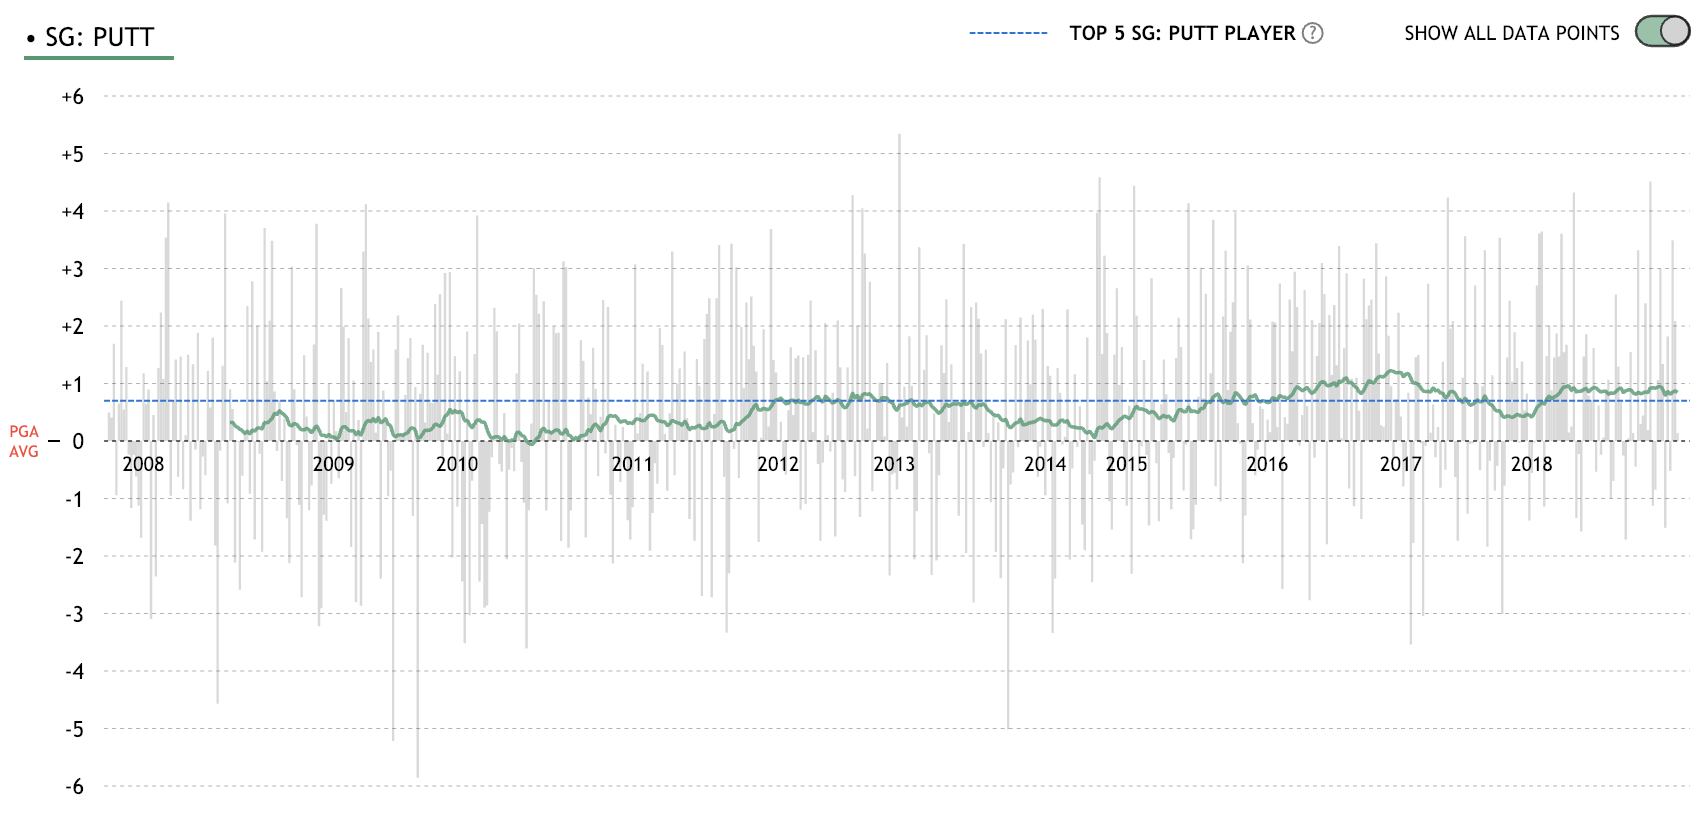
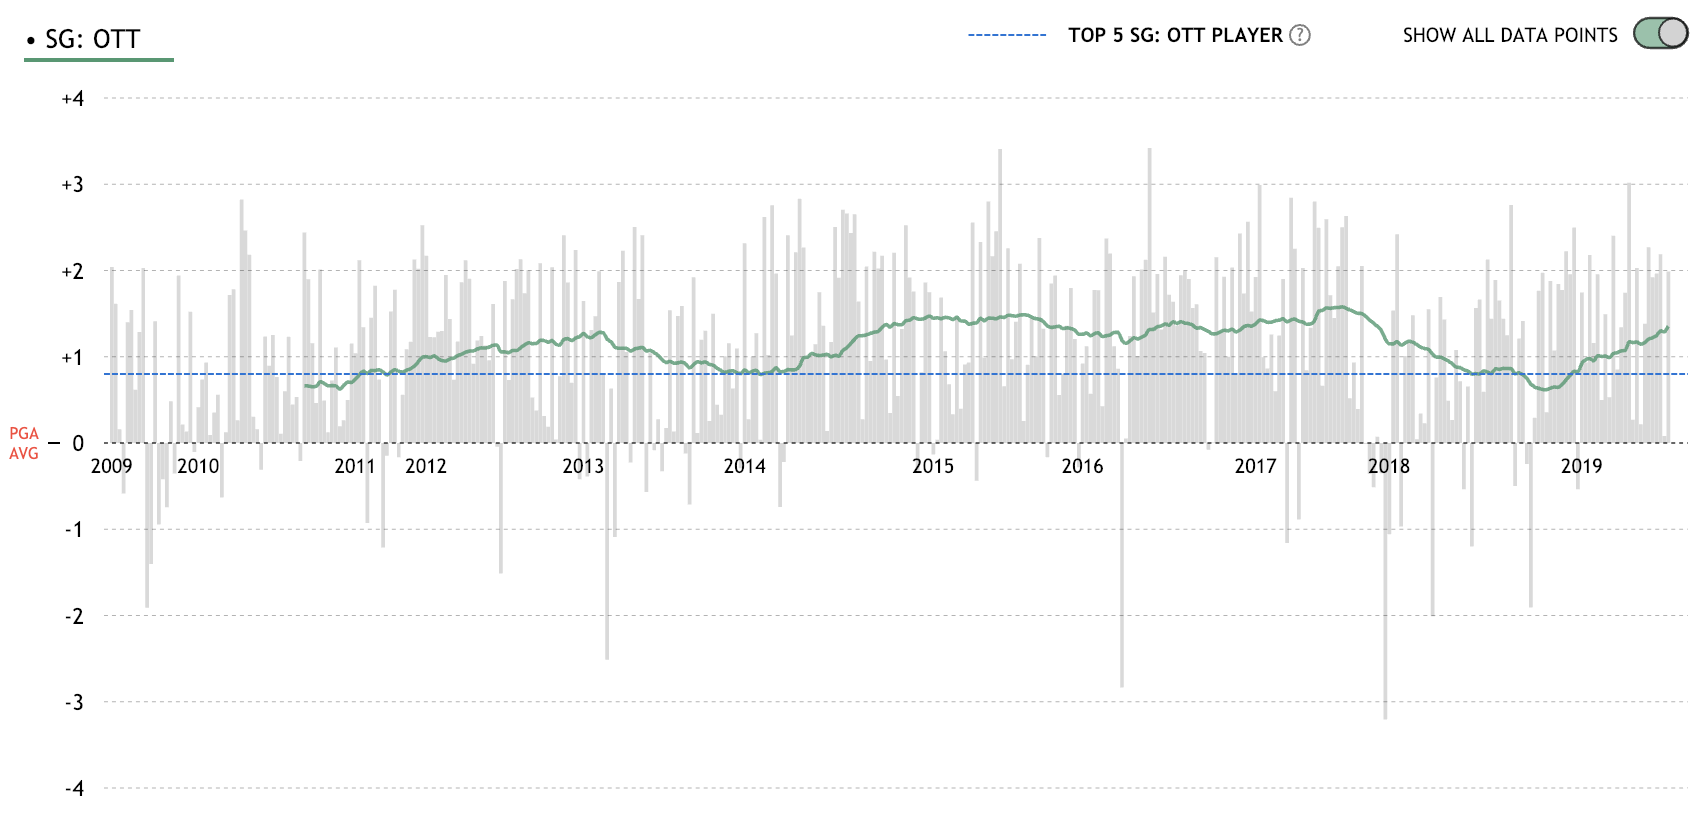
It is remarkable how consistent Rahm’s off-the-tee performance has been, effectively giving him a 1 stroke advantage in each round he plays (of course, this only works out on average). Jon Rahm’s career is somewhat of an outlier, even for OTT performance, in its stability over time. In the two graphs below, we contrast the long-term performance of a top putter (Jason Day) and that of a top driver of the ball (Rory McIlroy):
Jason Day strokes-gained: putting:
Rory McIlroy strokes-gained: off-the-tee:
The upshot of these graphs is that there appears to be much less random fluctuation in performance off-the-tee than in putting. What does this mean for predicting future performance? It means we should expect less regression to the mean when analyzing off-the-tee performance. In practice, holding strokes-gained total equal, we should be more confident in players who are gaining strokes off-the-tee than players who have gained strokes on the greens.
Overall, the predictive hierarchy of the strokes-gained categories appears to go: OTT > APP > ARG > PUTT. If there are differences in the predictive value of each strokes-gained category, it follows that using the categories can improve upon the predictions made by using strokes-gained totals alone. If you want to dig into this some more, check out this section in our model methodology write-up.
It’s probably not surprising that off-the-tee performance is lower variance than other performance categories; SG:OTT is in large part determined by the distance a golfer is hitting their tee shots, and distance is not something a golfer loses or gains overnight. Conversely, as all golfers know, performance on the greens can be much more fickle, even for the professionals.
A tournament matchup this week where including the golfers’ respective detailed strokes-gained performance in our model matters is that between Keegan Bradley and Brandt Snedeker. Bradley’s predicted strokes-gained per round went from +1.05 to +1.22 after incorporating his category performances, while Snedeker went from +0.65 to +0.46.
Bet365 is pricing this as an even matchup, with odds of 1.91 for both players. We have Bradley winning outright over 72 holes 61% of the time, yielding a 16% edge (ties result in a lost bet). Using our model predictions without the strokes-gained categories yields estimates of roughly 54% and 41% in favour of Bradley; reducing that edge from 16% to just 3%.
Bradley vs Snedeker tournament matchup:


