February 3, 2023
How sharp are bookmakers? Part II
If you haven't read the first edition of
How sharp are bookmakers? (HSB1),
it would be a good idea to start with that, but it's not necessary for getting something out of this post.
Some details are omitted here that were covered in HSB1—and I try to note when that is the
case—so if something isn't quite adding up that's the first place to check for an explanation.
The data used for this post covers the 2021 and 2022 calendar years
and consists of matchups and 3-balls from 11 sportsbooks.
There are four distinct sections to this post that aren't in any particular order.
Analyzing books: margin and calibration
To start I look at how the margin/overround/vig differs by bookmaker.
(Throughout this article I'll be using margin and overround interchangeably. The
subtle difference between overround and vig is explained
here.)
In this section I only use data from 2022 as it is the most relevant data,
and sample size is not as much of an issue when analyzing a book's margin.
To make things comparable across bookmakers each bet type is analyzed separately.
This first table looks at
matchups where ties are void:
Matchups that resulted in a tie are not included as this will favour samples that contain more round matchups when doing the blind betting exercise (because ties occur more often in round matchups than tournament matchups, and a tie returns your money—a good outcome when betting blindly). Actual blind return is the ROI (profit per unit bet) from placing a 1 unit bet on both players in every matchup. Calculated blind return is a theoretical quantity, equal to -vig1. Margin-free return is the return from a blind betting strategy after removing the margin2 from the bookmaker's odds.
Surprisingly it's Bet365 that offered the best return from a blind betting strategy on ties-void matchups. Circa had the lowest total margin but their actual blind returns were worse due to how they allocated that margin (more on this below). Compared to what we found in HSB1, Pinnacle is now offering much worse prices: their blind return has gone from -3.7% in 2019-2020 to -5.6% in 2022. (Minor note: in HSB1 I didn't remove ties for this exercise, which moves returns slightly closer to zero; see here.) Finally, it's interesting to note that Betcris has one of the highest margins while also being considered the sharpest book for golf.
When actual and calculated blind returns deviate significantly, it means the bookmaker's odds were not perfectly calibrated. For example, the theoretical return from betting randomly at Circa was -3.9% while the actual return was -4.7%. The reason for this difference is that underdogs at Circa lost more than their margin-free odds would have predicted. If you are betting 1 unit on both golfers this results in worse returns (see the example here). This is also reflected in the margin-free return, which should approximately equal the difference between actual and theoretical blind returns. As was explained in HSB1, a negative margin-free return indicates the presence of a favourite-longshot bias: the bookmaker puts proportionally more of the margin on longshots than favourites. Circa and Unibet are the only two books that appear to have a meaningful fav-longshot bias in their ties-void matchups. This might be an intentional pricing decision (or an unintentional one), or it could just be due to randomness (especially in the case of Circa whose sample size is not huge).
The next table displays the same information for matchups where ties are offered as a separate bet. In the blind betting exercises (with and without the margin removed), I don't bet on the Tie. However, the Tie odds are used when calculating the theoretical blind return.3
These matchups have significantly more margin added to them, which is interesting as there isn't an obvious reason why this would be the case. Because I don't bet on the Tie, the actual blind return and the margin-free return will be lower if more ties occur than expected—this is what happened in the Pointsbet sample. To finish, here is the same analysis for 3-balls:
Now we see a substantial negative margin-free return across all books, indicating the presence of a meaningful favourite-longshot bias. Interestingly this pattern did not show up in any of the 2019-2021 seasons. To get a sense of the magnitude of the bias, the next table shows the predicted and actual win frequencies of 3-ball underdogs in each of the last 4 years, where an underdog was defined as a golfer with a less than 30% chance of winning (according to the bookmaker's margin-free price).
From 2019-2021, underdogs won slightly more than the bookmaker's margin-free odds predicted, while in 2022 they underperformed by 2.2%! The sample sizes are not huge (as most books tend to offer the same 3-balls), so the results from the 2022 season could still be due to randomness. Further, the fact that we see the bias at every book makes it more likely that underdogs just won less than they "should have" in 2022, rather than all bookmakers adjusting how they price 3-balls. Regardless of the cause, this is something to keep an eye on in 2023.
| book | number of bets | actual blind return | calculated blind return | margin-free return |
|---|---|---|---|---|
| bet365 | 3868 | -4.44% | -4.53% | 0.09% |
| circa | 2260 | -4.69% | -3.9% | -0.81% |
| bovada | 7542 | -4.77% | -4.75% | -0.02% |
| draftkings | 5100 | -4.82% | -4.8% | -0.02% |
| betonline | 8530 | -5.02% | -5.04% | 0.02% |
| betmgm | 2458 | -5.49% | -5.02% | -0.5% |
| pinnacle | 14225 | -5.58% | -5.35% | -0.25% |
| fanduel | 1122 | -5.65% | -5.61% | -0.04% |
| betcris | 11192 | -6.1% | -6.09% | -0.01% |
| unibet | 6707 | -6.26% | -5.78% | -0.51% |
Matchups that resulted in a tie are not included as this will favour samples that contain more round matchups when doing the blind betting exercise (because ties occur more often in round matchups than tournament matchups, and a tie returns your money—a good outcome when betting blindly). Actual blind return is the ROI (profit per unit bet) from placing a 1 unit bet on both players in every matchup. Calculated blind return is a theoretical quantity, equal to -vig1. Margin-free return is the return from a blind betting strategy after removing the margin2 from the bookmaker's odds.
Surprisingly it's Bet365 that offered the best return from a blind betting strategy on ties-void matchups. Circa had the lowest total margin but their actual blind returns were worse due to how they allocated that margin (more on this below). Compared to what we found in HSB1, Pinnacle is now offering much worse prices: their blind return has gone from -3.7% in 2019-2020 to -5.6% in 2022. (Minor note: in HSB1 I didn't remove ties for this exercise, which moves returns slightly closer to zero; see here.) Finally, it's interesting to note that Betcris has one of the highest margins while also being considered the sharpest book for golf.
When actual and calculated blind returns deviate significantly, it means the bookmaker's odds were not perfectly calibrated. For example, the theoretical return from betting randomly at Circa was -3.9% while the actual return was -4.7%. The reason for this difference is that underdogs at Circa lost more than their margin-free odds would have predicted. If you are betting 1 unit on both golfers this results in worse returns (see the example here). This is also reflected in the margin-free return, which should approximately equal the difference between actual and theoretical blind returns. As was explained in HSB1, a negative margin-free return indicates the presence of a favourite-longshot bias: the bookmaker puts proportionally more of the margin on longshots than favourites. Circa and Unibet are the only two books that appear to have a meaningful fav-longshot bias in their ties-void matchups. This might be an intentional pricing decision (or an unintentional one), or it could just be due to randomness (especially in the case of Circa whose sample size is not huge).
The next table displays the same information for matchups where ties are offered as a separate bet. In the blind betting exercises (with and without the margin removed), I don't bet on the Tie. However, the Tie odds are used when calculating the theoretical blind return.3
| book | number of bets | actual blind return | calculated blind return | margin-free return |
|---|---|---|---|---|
| pointsbet | 2166 | -7.59% | -6.55% | -1.12% |
| fanduel | 1875 | -7.62% | -7.97% | 0.38% |
| bet365 | 3061 | -8.96% | -8.99% | 0.03% |
These matchups have significantly more margin added to them, which is interesting as there isn't an obvious reason why this would be the case. Because I don't bet on the Tie, the actual blind return and the margin-free return will be lower if more ties occur than expected—this is what happened in the Pointsbet sample. To finish, here is the same analysis for 3-balls:
| book | number of bets | actual blind return | calculated blind return | margin-free return |
|---|---|---|---|---|
| betonline | 2536 | -7.98% | -7.05% | -1% |
| fanduel | 3734 | -9.39% | -8.02% | -1.49% |
| betcris | 261 | -9.42% | -6.11% | -3.54% |
| unibet | 3782 | -9.54% | -8.37% | -1.28% |
| betmgm | 3286 | -9.8% | -8.53% | -1.39% |
| bet365 | 4579 | -9.9% | -8.58% | -1.45% |
| bovada | 4181 | -9.99% | -8.76% | -1.34% |
| draftkings | 3556 | -10.07% | -9.04% | -1.14% |
| pointsbet | 4462 | -10.14% | -8.67% | -1.61% |
Now we see a substantial negative margin-free return across all books, indicating the presence of a meaningful favourite-longshot bias. Interestingly this pattern did not show up in any of the 2019-2021 seasons. To get a sense of the magnitude of the bias, the next table shows the predicted and actual win frequencies of 3-ball underdogs in each of the last 4 years, where an underdog was defined as a golfer with a less than 30% chance of winning (according to the bookmaker's margin-free price).
| year | unique bets | predicted probability | actual probability |
|---|---|---|---|
| 2019 | 2513 | 25.3% | 25.4% |
| 2020 | 3545 | 25.2% | 25.7% |
| 2021 | 4710 | 25.7% | 26.4% |
| 2022 | 4999 | 25.9% | 23.7% |
From 2019-2021, underdogs won slightly more than the bookmaker's margin-free odds predicted, while in 2022 they underperformed by 2.2%! The sample sizes are not huge (as most books tend to offer the same 3-balls), so the results from the 2022 season could still be due to randomness. Further, the fact that we see the bias at every book makes it more likely that underdogs just won less than they "should have" in 2022, rather than all bookmakers adjusting how they price 3-balls. Regardless of the cause, this is something to keep an eye on in 2023.
Analyzing Data Golf: calibration
Here is the calibration plot for our predictions for matchups (both tournament
and round) in 2021-2022. Each dot represents an average of all observations
in a 5% window of DG probabilities (e.g. 30-35%); the dashed line shows what perfect
calibration looks like (x=y).
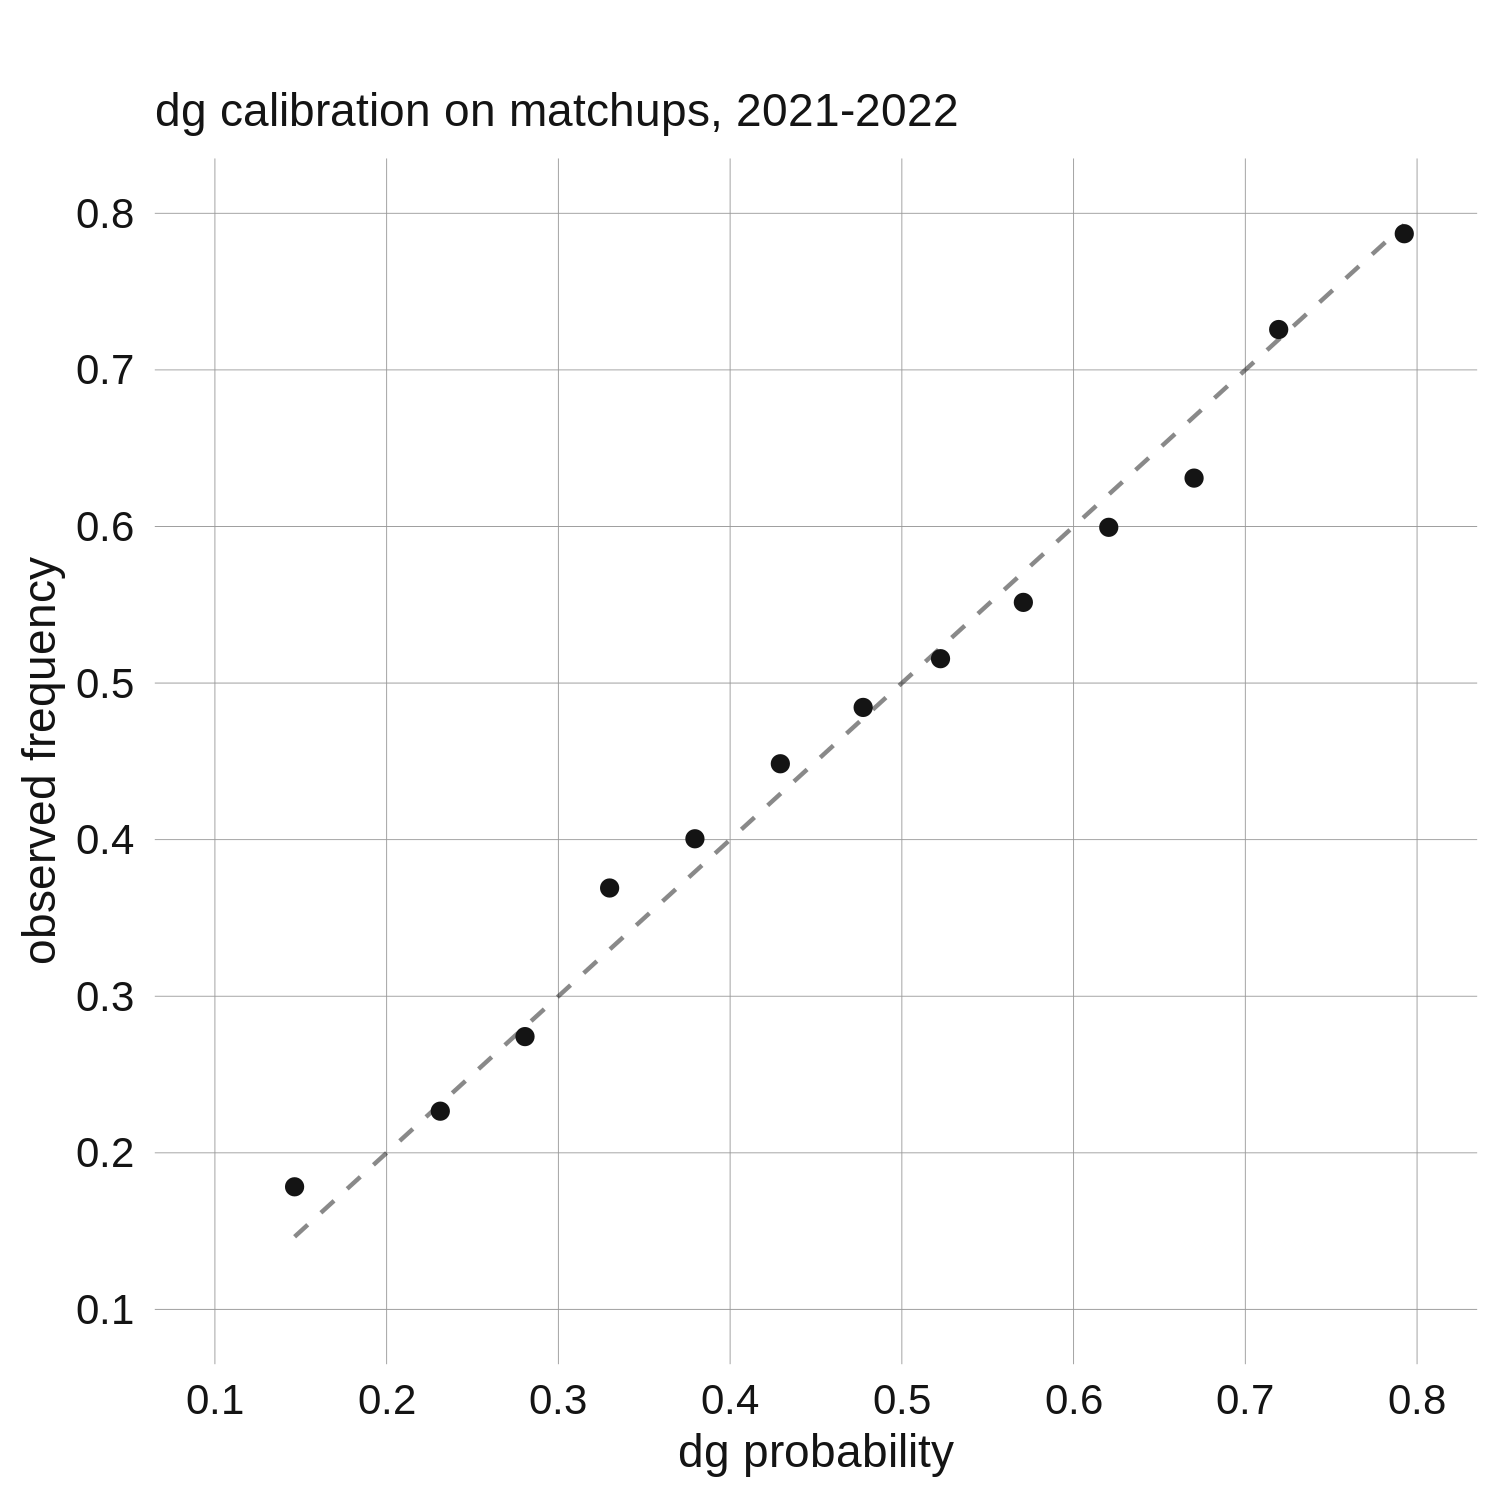
 Well, this does not look good. Apart from the 3 low-sample size points at either end of the plot
(the plot is symmetrical, as both players from every matchup are included), our model appears to be overconfident!
Favoured golfers win less than they are predicted to, while
underdogs win more. For example, in the 55-60% bin, our average win probability
was 57.0%, but these golfers only won 55.1% of the time. With a sample of over 35K bets in this bin,
this discrepancy can't be explained by bad luck alone.
Well, this does not look good. Apart from the 3 low-sample size points at either end of the plot
(the plot is symmetrical, as both players from every matchup are included), our model appears to be overconfident!
Favoured golfers win less than they are predicted to, while
underdogs win more. For example, in the 55-60% bin, our average win probability
was 57.0%, but these golfers only won 55.1% of the time. With a sample of over 35K bets in this bin,
this discrepancy can't be explained by bad luck alone.
This puzzled me for a while. As I said in HSB1, it's not hard to achieve "good calibration" in data-rich settings such as sports. As long as your model is not overfit, any standard statistical procedure should produce calibrated predictions. Further, I know from years of out-of-sample predictions that our model is well-calibrated when looking at finish position predictions. So what's going on here?
The answer is sample selection. If I wanted to test the calibration of our model on matchups, I would generate probabilistic predictions for a large number of matchups between randomly selected golfers, and produce a calibration plot as above. However, with betting data the matchups are not randomly selected: bookmakers choose which matchups they want to offer, and they tend to offer matchups between players that they believe are (approximately) evenly matched. Given that actual win probabilities lie between the market's price and our price (see HSB1, or the next section), this gives the illusion that our model is miscalibrated. The next plot illustrates this (I only use 2022 as it produced a cleaner plot), again binning observations at 5% intervals.
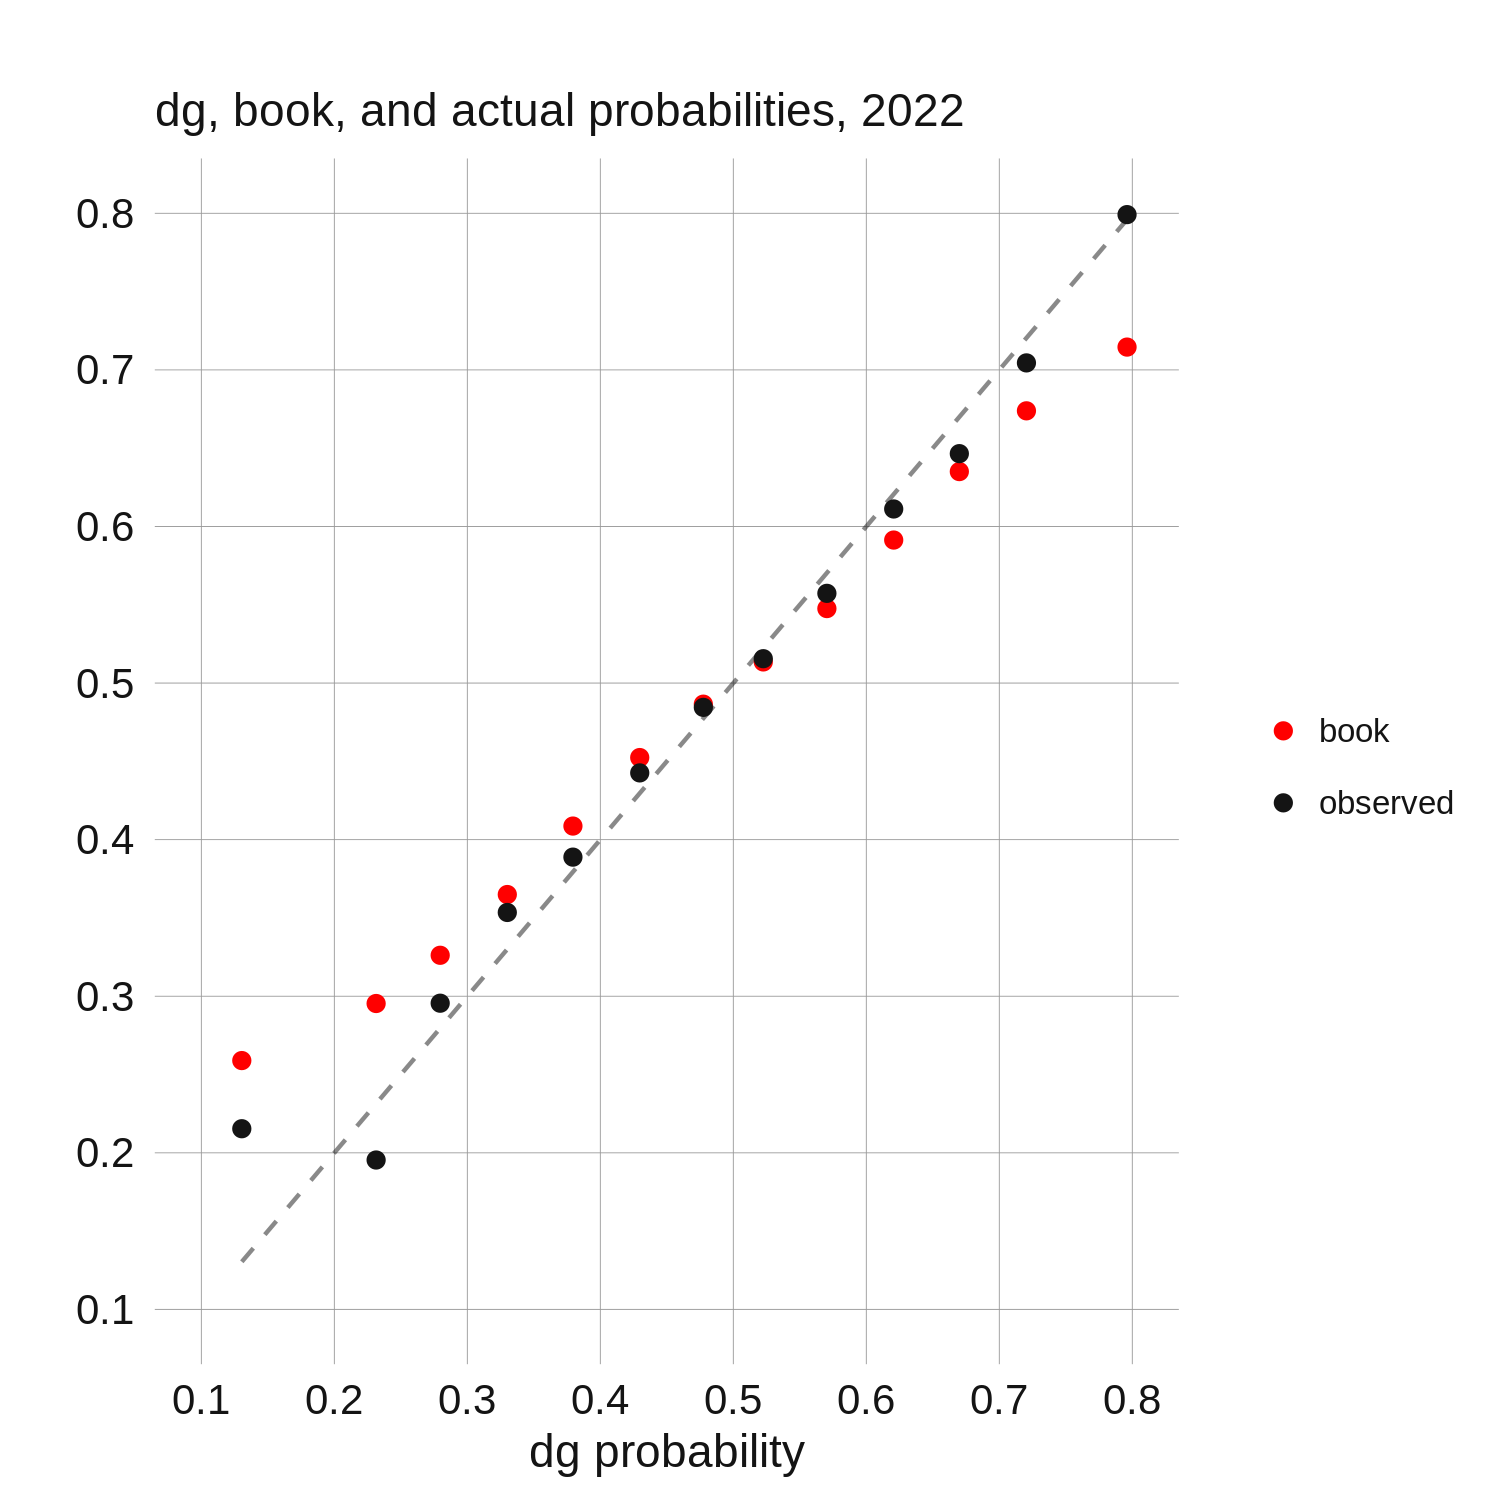
 As expected, actual win probabilities lie in between the bookmaker's margin-free price and
our price (the dashed line). The further we move away from 50%, the larger is the discrepancy between
our price and the bookmaker's, and—because the bookmaker's price adds predictive value to our
price—the more the observed probabilities deviate from our predictions. An intuitive way to understand
this is to consider the case where a bookmaker exclusively offers evenly-priced matchups. Unless the bookmaker's
price adds zero predictive value to your model, the model probabilities above 50% will always overestimate the true
probability (and the opposite will be true below 50%).
As expected, actual win probabilities lie in between the bookmaker's margin-free price and
our price (the dashed line). The further we move away from 50%, the larger is the discrepancy between
our price and the bookmaker's, and—because the bookmaker's price adds predictive value to our
price—the more the observed probabilities deviate from our predictions. An intuitive way to understand
this is to consider the case where a bookmaker exclusively offers evenly-priced matchups. Unless the bookmaker's
price adds zero predictive value to your model, the model probabilities above 50% will always overestimate the true
probability (and the opposite will be true below 50%).
If you are still a bit skeptical of this explanation, the next plot shows the calibration of DG predictions for 3-balls, which is a bet type where bookmakers have less control over which players they offer (because 3-balls are only offered for golfers who are paired together in the tournament).
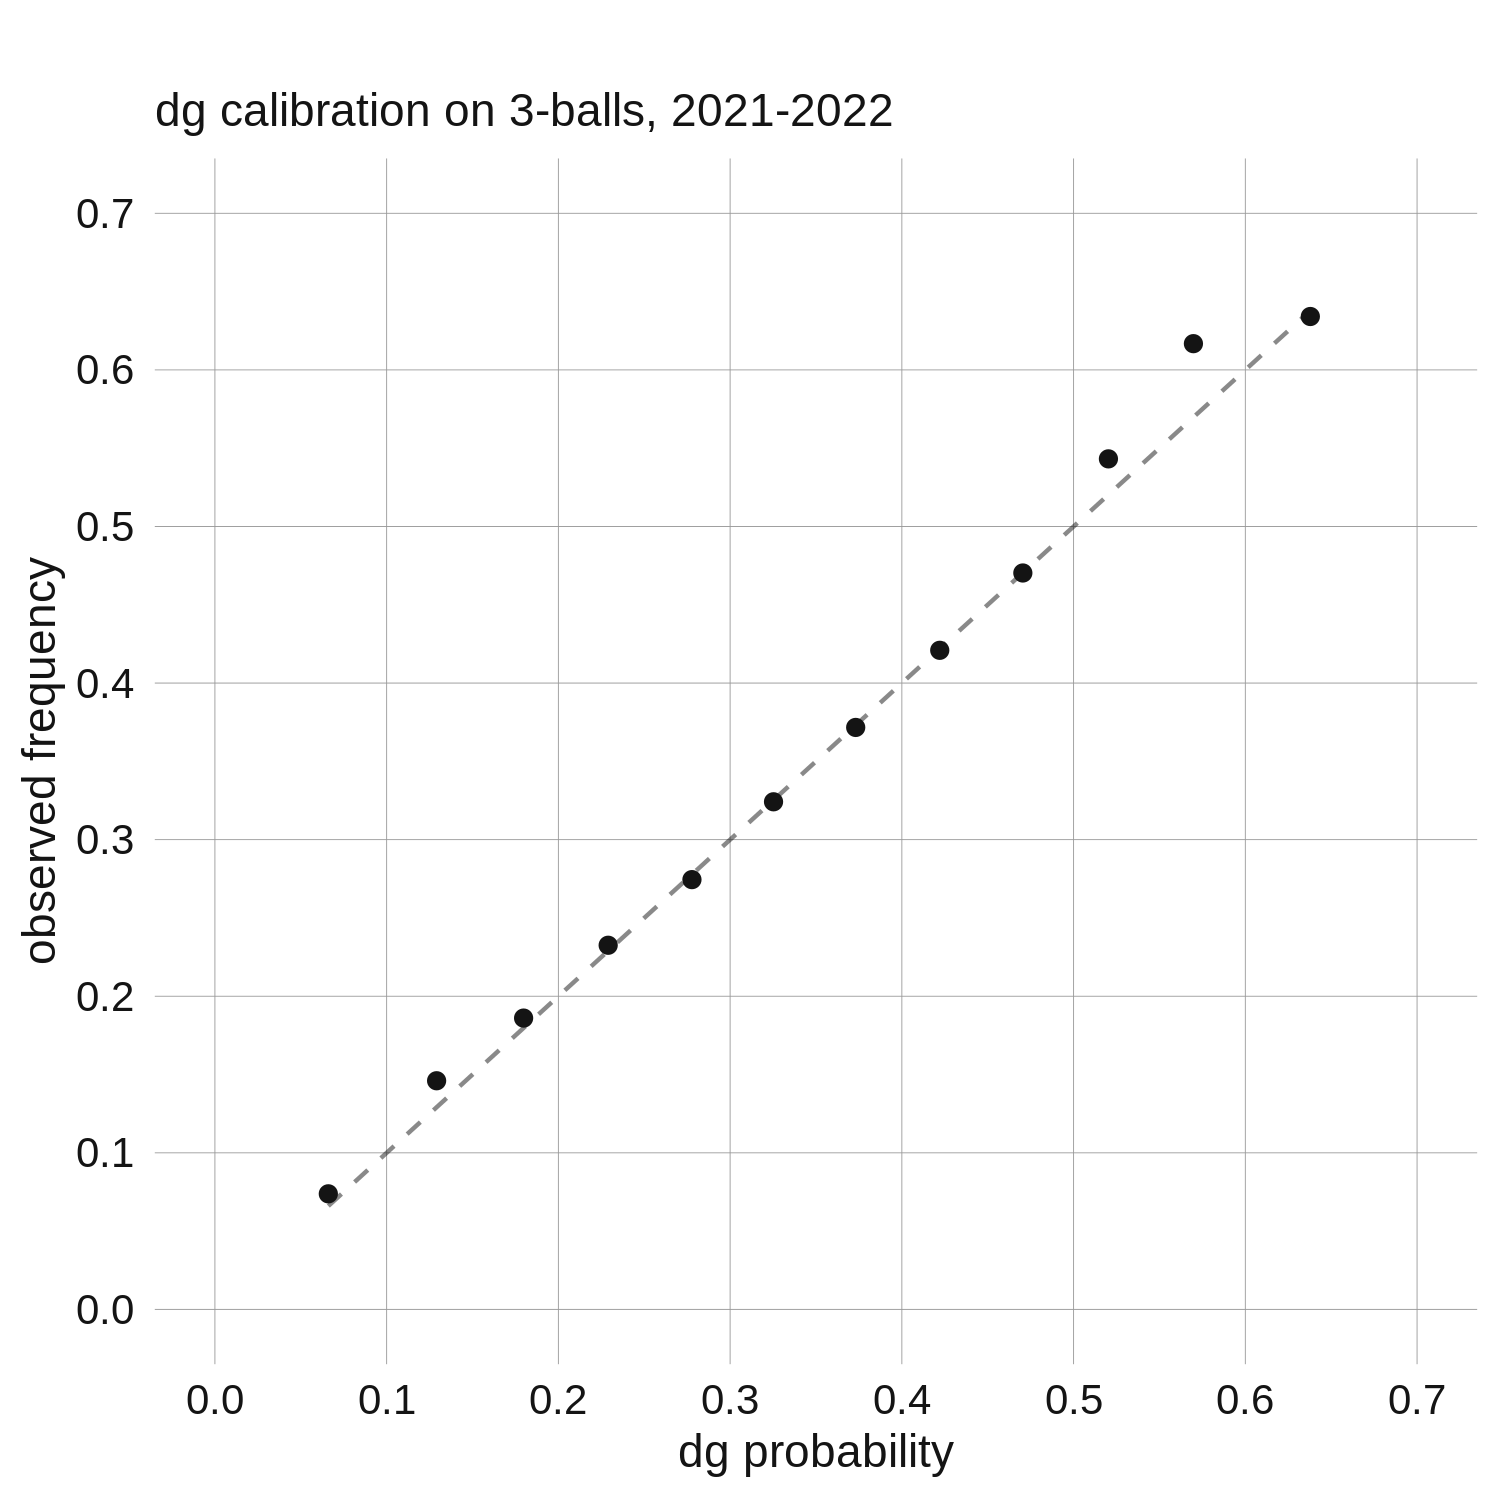
 Now our model's calibration looks good (the low-data bins here are below 20% and above 50%).
Because there are 3 participants in these bets, 33.3% is the changeover point for defining underdogs and
favourites. The sample selection process for 3-balls is not completely random—good players still tend to get paired
with other good players—but the bookmaker's influence over which players are offered is much more limited than it is with
matchups (they do still have some influence in that they decide which pairings to offer).
As a result, our model's probabilities are not pulled in any particular direction the way they were with matchups.
Now our model's calibration looks good (the low-data bins here are below 20% and above 50%).
Because there are 3 participants in these bets, 33.3% is the changeover point for defining underdogs and
favourites. The sample selection process for 3-balls is not completely random—good players still tend to get paired
with other good players—but the bookmaker's influence over which players are offered is much more limited than it is with
matchups (they do still have some influence in that they decide which pairings to offer).
As a result, our model's probabilities are not pulled in any particular direction the way they were with matchups.
Looking at the 2021 and 2022 data together does hide the fact that in 2022 our probabilities showed a slight favourite-longshot bias, while in 2021 they showed the opposite. I think in normal years (as shown in the previous section, 2022 may have been abnormal in the sense that underdogs won less than they should have in 3-balls) sample selection plays a small role with 3-balls, which causes our probabilities to slightly overestimate favourites' win probabilities and underestimate underdogs.
This is a pretty cool example of how sample selection—which observations show up in your data—can affect the relationships you estimate. More generally, this selection mechanism will play a role whenever a bookmaker uses their assessment of players or teams in deciding which bets to offer.
This puzzled me for a while. As I said in HSB1, it's not hard to achieve "good calibration" in data-rich settings such as sports. As long as your model is not overfit, any standard statistical procedure should produce calibrated predictions. Further, I know from years of out-of-sample predictions that our model is well-calibrated when looking at finish position predictions. So what's going on here?
The answer is sample selection. If I wanted to test the calibration of our model on matchups, I would generate probabilistic predictions for a large number of matchups between randomly selected golfers, and produce a calibration plot as above. However, with betting data the matchups are not randomly selected: bookmakers choose which matchups they want to offer, and they tend to offer matchups between players that they believe are (approximately) evenly matched. Given that actual win probabilities lie between the market's price and our price (see HSB1, or the next section), this gives the illusion that our model is miscalibrated. The next plot illustrates this (I only use 2022 as it produced a cleaner plot), again binning observations at 5% intervals.
If you are still a bit skeptical of this explanation, the next plot shows the calibration of DG predictions for 3-balls, which is a bet type where bookmakers have less control over which players they offer (because 3-balls are only offered for golfers who are paired together in the tournament).
Looking at the 2021 and 2022 data together does hide the fact that in 2022 our probabilities showed a slight favourite-longshot bias, while in 2021 they showed the opposite. I think in normal years (as shown in the previous section, 2022 may have been abnormal in the sense that underdogs won less than they should have in 3-balls) sample selection plays a small role with 3-balls, which causes our probabilities to slightly overestimate favourites' win probabilities and underestimate underdogs.
This is a pretty cool example of how sample selection—which observations show up in your data—can affect the relationships you estimate. More generally, this selection mechanism will play a role whenever a bookmaker uses their assessment of players or teams in deciding which bets to offer.
Analyzing Data Golf: betting results and odds movement
Here are our betting results at various expected value thresholds
for 2021, using all events and bookmakers that we covered.
And for 2022:
At all thresholds 2021 was a better year for our matchup betting. Interestingly, in both seasons when using our odds and the bookmaker's odds to predict outcomes (using all bets regardless of expected value), the optimal weights4 put roughly 50% on our odds. This means that our prices had the same predictive power overall relative to bookmakers' in both years, we just happened to have more of that predictive power come from the sample of bets that were +EV in 2021.
The next table shows our betting results by bookmaker at the (arbitrarily-chosen) 5% threshold, for 2021 and 2022 combined:
And at the 10% threshold:
Lastly I summarize our betting results by bookmaker at the 5% threshold (again for 2021-2022 combined):
And again at the 10% threshold:
Next I summarize the relationship between each bookmaker's (margin-free) odds and our odds. The data used is from 2021 and 2022, but excludes 3-balls. Including 3-balls makes correlations artificially high for the books who offer them, and in general makes things less comparable across bookmakers. The table below is sorted by adjusted correlation with opening odds, which is meant to capture how correlated each bookmaker's opening odds are with Data Golf odds, after controlling for the specific set of bets that a bookmaker offered. Raw correlations can't be meaningfully compared across books because samples with more unevenly-matched golfers yield naturally higher correlations. To make the correlations comparable, the idea is look at the common bets offered by each pair of bookmakers and compare their respective correlations with our odds on that sample. For example, there were 1069 bets that were offered by both Pointsbet and Betcris; in that overlapping sample, Pointsbet's opening price correlation with our price was 0.82 while Betcris' was 0.89. (Compare that to their correlations using all bets of 0.92 and 0.80; this means that Pointsbet's sample produces naturally higher correlations with our odds than Betcris' sample.) The adjusted correlation uses Betcris' sample as the reference sample, giving it the interpretation of "the correlation we would expect between a bookmaker's odds and DG odds if the bookmaker offered the same bets as Betcris". For those interested, there are some statistical details here.5
The calculations behind the columns in the table showing odds movement (columns 5-8) are explained in detail in HSB1. Briefly, these columns show how often each book's opening margin-free price disagrees with our odds by at least X% (fraction with X% adv), and in those instances how much their price moves towards ours as a percentage of the initial gap (book -> dg, X% adv). As an example, if Pinnacle's opening margin-free price was 55% and their closing price was 52%, while our price was 50%, this would be a starting advantage of 10% (\( \frac{0.55}{0.5} \)), and Pinnacle's odds moved 60% (\( \frac{0.55-0.52}{0.55-0.5} \)) of the way towards our odds from opening to close.
For those who use our site regularly none of this should be too surprising, but it's always good to add numbers to intuition. A few notes: 1) Circa follows our odds very (very!) closely: only 1% of bets they offered showed a disagreement of more than 15%. (And remember this is using their margin-free price; a 15% disagreement translates to only a ~10% EV edge). 2) Compared to the numbers in HSB1 for 2019-2020, bookmakers moved their odds closer to our numbers when their was a large disagreement. 3) If you are puzzled by the declining raw correlations from opening to close despite the fact that a book's odds tended to move towards ours (e.g. Circa, BetOnline), see footnote 5 in HSB1.
| threshold | number of bets | unique bets | exp. roi | profit | roi |
|---|---|---|---|---|---|
| 0% | 35624 | 18210 | 4.29% | -70.3 | -0.2% |
| 1% | 28508 | 15278 | 5.24% | 8.6 | 0.03% |
| 2% | 22423 | 12496 | 6.26% | 167.3 | 0.75% |
| 3% | 17525 | 10143 | 7.32% | 147.7 | 0.84% |
| 4% | 13727 | 8194 | 8.38% | 263.9 | 1.92% |
| 5% | 10627 | 6504 | 9.52% | 278.3 | 2.62% |
| 6% | 8401 | 5229 | 10.59% | 312.1 | 3.72% |
| 7% | 6592 | 4205 | 11.71% | 267.1 | 4.05% |
| 8% | 5213 | 3415 | 12.83% | 273.9 | 5.25% |
| 9% | 4084 | 2734 | 14.04% | 269.5 | 6.6% |
| 10% | 3223 | 2216 | 15.26% | 273.8 | 8.5% |
| 11% | 2618 | 1813 | 16.36% | 251.1 | 9.59% |
| 12% | 2101 | 1493 | 17.57% | 241.5 | 11.49% |
| 13% | 1712 | 1249 | 18.73% | 214.3 | 12.52% |
| 14% | 1430 | 1054 | 19.76% | 197.4 | 13.8% |
| 15% | 1139 | 853 | 21.1% | 162.1 | 14.23% |
| 16% | 953 | 729 | 22.19% | 145.7 | 15.29% |
| 17% | 767 | 603 | 23.59% | 143 | 18.64% |
| 18% | 616 | 497 | 25.1% | 137.9 | 22.39% |
| 19% | 510 | 417 | 26.47% | 125.4 | 24.6% |
| 20% | 423 | 353 | 27.9% | 101.6 | 24.01% |
And for 2022:
| threshold | number of bets | unique bets | exp. roi | profit | roi |
|---|---|---|---|---|---|
| 0% | 36824 | 18897 | 3.91% | -421 | -1.14% |
| 1% | 28680 | 15199 | 4.88% | -200 | -0.7% |
| 2% | 22155 | 12086 | 5.88% | -152.5 | -0.69% |
| 3% | 17102 | 9601 | 6.88% | -2.2 | -0.01% |
| 4% | 13032 | 7534 | 7.94% | 27.6 | 0.21% |
| 5% | 9903 | 5894 | 9.04% | 56 | 0.57% |
| 6% | 7612 | 4673 | 10.12% | 92.8 | 1.22% |
| 7% | 5837 | 3694 | 11.22% | 92.9 | 1.59% |
| 8% | 4519 | 2911 | 12.32% | 97.9 | 2.17% |
| 9% | 3475 | 2303 | 13.47% | 73.5 | 2.12% |
| 10% | 2681 | 1793 | 14.65% | 121.9 | 4.55% |
| 11% | 2042 | 1394 | 15.96% | 71.8 | 3.52% |
| 12% | 1592 | 1108 | 17.22% | 123.6 | 7.76% |
| 13% | 1274 | 876 | 18.4% | 74.6 | 5.86% |
| 14% | 998 | 701 | 19.76% | 22.2 | 2.23% |
| 15% | 790 | 576 | 21.15% | 21.6 | 2.74% |
| 16% | 637 | 475 | 22.51% | 29.6 | 4.65% |
| 17% | 498 | 383 | 24.19% | 20.2 | 4.06% |
| 18% | 415 | 315 | 25.53% | 27.6 | 6.65% |
| 19% | 328 | 254 | 27.38% | 23.6 | 7.2% |
| 20% | 280 | 213 | 28.73% | 25.3 | 9.05% |
At all thresholds 2021 was a better year for our matchup betting. Interestingly, in both seasons when using our odds and the bookmaker's odds to predict outcomes (using all bets regardless of expected value), the optimal weights4 put roughly 50% on our odds. This means that our prices had the same predictive power overall relative to bookmakers' in both years, we just happened to have more of that predictive power come from the sample of bets that were +EV in 2021.
The next table shows our betting results by bookmaker at the (arbitrarily-chosen) 5% threshold, for 2021 and 2022 combined:
| bet type | number of bets | uniques | exp. roi | profit | roi |
|---|---|---|---|---|---|
| tournament matchups |
4753 | 3746 | 9.21% | 184.5 | 3.88% |
| round matchups |
7400 | 4790 | 8.61% | 50.7 | 0.69% |
| 3-balls | 8377 | 3862 | 9.93% | 99.1 | 1.18% |
And at the 10% threshold:
| bet type | number of bets | uniques | exp. roi | profit | roi |
|---|---|---|---|---|---|
| tournament matchups |
1374 | 1209 | 14.57% | 126.8 | 9.22% |
| round matchups |
1719 | 1197 | 14.4% | 87.7 | 5.1% |
| 3-balls | 2811 | 1603 | 15.53% | 181.2 | 6.45% |
Lastly I summarize our betting results by bookmaker at the 5% threshold (again for 2021-2022 combined):
| book | number of bets | exp. roi | profit | roi |
|---|---|---|---|---|
| pinnacle | 1652 | 8.36% | 143.3 | 8.67% |
| fanduel | 3019 | 10.45% | 101.4 | 3.36% |
| bet365 | 3248 | 9.48% | 72.9 | 2.24% |
| bovada | 3248 | 9.3% | 50.3 | 1.55% |
| betonline | 1096 | 8.3% | 33.1 | 3.02% |
| betcris | 1884 | 8.75% | 18.1 | 0.96% |
| pointsbet | 1163 | 8.93% | 7.6 | 0.65% |
| circa | 84 | 9.65% | -5.5 | -6.56% |
| unibet | 850 | 8.72% | -14.7 | -1.73% |
| betmgm | 1339 | 9.91% | -26.9 | -2.01% |
| draftkings | 2947 | 9.11% | -45.3 | -1.54% |
And again at the 10% threshold:
| book | number of bets | exp. roi | profit | roi |
|---|---|---|---|---|
| bovada | 883 | 15.61% | 92.2 | 10.44% |
| bet365 | 1016 | 14.86% | 84.6 | 8.32% |
| pinnacle | 330 | 14.84% | 78 | 23.63% |
| fanduel | 1146 | 15.83% | 70.9 | 6.19% |
| betmgm | 429 | 15.87% | 29.3 | 6.82% |
| betcris | 462 | 14.21% | 22.4 | 4.86% |
| draftkings | 854 | 14.19% | 13.7 | 1.61% |
| pointsbet | 320 | 14.04% | 10.9 | 3.42% |
| betonline | 228 | 13.99% | 9.7 | 4.26% |
| circa | 18 | 20.75% | -0.3 | -1.52% |
| unibet | 218 | 13.67% | -15.8 | -7.23% |
Next I summarize the relationship between each bookmaker's (margin-free) odds and our odds. The data used is from 2021 and 2022, but excludes 3-balls. Including 3-balls makes correlations artificially high for the books who offer them, and in general makes things less comparable across bookmakers. The table below is sorted by adjusted correlation with opening odds, which is meant to capture how correlated each bookmaker's opening odds are with Data Golf odds, after controlling for the specific set of bets that a bookmaker offered. Raw correlations can't be meaningfully compared across books because samples with more unevenly-matched golfers yield naturally higher correlations. To make the correlations comparable, the idea is look at the common bets offered by each pair of bookmakers and compare their respective correlations with our odds on that sample. For example, there were 1069 bets that were offered by both Pointsbet and Betcris; in that overlapping sample, Pointsbet's opening price correlation with our price was 0.82 while Betcris' was 0.89. (Compare that to their correlations using all bets of 0.92 and 0.80; this means that Pointsbet's sample produces naturally higher correlations with our odds than Betcris' sample.) The adjusted correlation uses Betcris' sample as the reference sample, giving it the interpretation of "the correlation we would expect between a bookmaker's odds and DG odds if the bookmaker offered the same bets as Betcris". For those interested, there are some statistical details here.5
The calculations behind the columns in the table showing odds movement (columns 5-8) are explained in detail in HSB1. Briefly, these columns show how often each book's opening margin-free price disagrees with our odds by at least X% (fraction with X% adv), and in those instances how much their price moves towards ours as a percentage of the initial gap (book -> dg, X% adv). As an example, if Pinnacle's opening margin-free price was 55% and their closing price was 52%, while our price was 50%, this would be a starting advantage of 10% (\( \frac{0.55}{0.5} \)), and Pinnacle's odds moved 60% (\( \frac{0.55-0.52}{0.55-0.5} \)) of the way towards our odds from opening to close.
| book | adj. correlation w/ opening odds |
raw correlation w/ opening odds |
raw correlation w/ closing odds |
fraction w/ 5% adv |
book -> dg (5% adv) |
fraction w/ 15% adv |
book -> dg (15% adv) |
|---|---|---|---|---|---|---|---|
| bet365 | 0.73 | 0.77 | 0.81 | 50% | 0.058 | 8% | 0.145 |
| fanduel | 0.75 | 0.85 | 0.91 | 55% | 0.177 | 12% | 0.329 |
| draftkings | 0.76 | 0.86 | 0.89 | 49% | 0.118 | 8% | 0.213 |
| pointsbet | 0.77 | 0.92 | 0.93 | 47% | 0.068 | 7% | 0.110 |
| bovada | 0.78 | 0.85 | 0.88 | 46% | 0.147 | 6% | 0.283 |
| betmgm | 0.78 | 0.90 | 0.92 | 41% | 0.068 | 6% | 0.119 |
| unibet | 0.78 | 0.91 | 0.92 | 38% | 0.071 | 4% | 0.171 |
| betcris | 0.80 | 0.80 | 0.82 | 41% | 0.095 | 4% | 0.153 |
| pinnacle | 0.82 | 0.91 | 0.92 | 38% | 0.277 | 3% | 0.412 |
| betonline | 0.85 | 0.90 | 0.89 | 26% | 0.239 | 2% | 0.362 |
| circa | 0.89 | 0.96 | 0.95 | 25% | 0.096 | 1% | 0.149 |
For those who use our site regularly none of this should be too surprising, but it's always good to add numbers to intuition. A few notes: 1) Circa follows our odds very (very!) closely: only 1% of bets they offered showed a disagreement of more than 15%. (And remember this is using their margin-free price; a 15% disagreement translates to only a ~10% EV edge). 2) Compared to the numbers in HSB1 for 2019-2020, bookmakers moved their odds closer to our numbers when their was a large disagreement. 3) If you are puzzled by the declining raw correlations from opening to close despite the fact that a book's odds tended to move towards ours (e.g. Circa, BetOnline), see footnote 5 in HSB1.
Analyzing books: odds movement and accuracy
Here's a quick primer on when
books release their PGA Tour and DP World Tour matchups (restricting our attention to those listed on our site).
In a normal week in 2022, BetOnline and Bet365 are the first to post tournament matchup prices, releasing them by
early Monday afternoon (ET). As far as I can tell they do this pretty independently, often not overlapping
with many of the matchups they offer. In general, Bet365 seems to do their own thing while
BetOnline copies everything in sight (apart from their initial opening odds).
Sometime Tuesday morning,
DraftKings, BetMGM, and Unibet will post their tournament matchups.
BetMGM and Unibet are generally just copying other books or us, while DraftKings seems to price independently.
Pinnacle used to post much earlier in 2019 and 2020, often being the first to post
on Monday. Now they typically don't post until late Tuesday morning, and usually don't deviate far from our prices or market prices at the time.
A bit later on Tuesday
Fanduel and Bovada will post their tournament matchups. Bovada copies other books, while Fanduel sometimes copies and other times prices independently.
Betcris then typically posts Tuesday afternoon, and they price independently. Finally, Circa usually posts a bit after
Betcris and they just copy the market or what's on our site.
Round matchups and 3-balls are typically posted after tee times are released,
so there are smaller differences in books' release times for those bet types. The only book I haven't mentioned so far is Pointsbet, who
only offers 3-balls and round matchups (in the locations we scrape their odds from).
The next table summarizes the relationships (in 2022) between the margin-free opening and closing odds of the 5 bookmakers I think are the most interesting to look at (I would do all 11 but the table gets too big). As before, 3-balls are not included. The columns should be straightforward to interpret, but refer to section 3 in HSB1 for more details and some relevant discussion.
As mentioned in the previous section, raw correlations can be misleading. The most informative column for understanding how closely related two bookmakers' (opening) odds are is probably fraction with 10% adv., which shows how often the books' margin-free opening odds have a ratio of 1.1 or higher. The two rightmost columns show that all bookmakers' odds tend to move towards each other when their opening odds show large discrepancies. Betcris appears to have the most influence, but it's important to remember that they also post later than the other 4 bookmakers in this table, which means some of the movement towards Betcris prices might occur before their odds are actually posted.
When planning the roadmap of this post, I wanted to include a more complete analysis of the relative quality of bookmakers' odds than what I did for HSB1. Unfortunately, this turns out to be a difficult task. There are two main issues. First, because differences in the relative quality of books' prices are small, the sample sizes required to detect these differences need to be large. Second, bookmakers don't all offer the same matchups, which makes fair comparisons between books tricky and also reduces the effective sample sizes for making these comparisons.
As with the earlier method used to adjust books' correlations with our odds, the strategy for estimating relative bookmaker quality involves comparing the performance of pairs of bookmakers on the common set of bets they offer. For every pair of bookmakers (plus Data Golf), I evaluate the quality of their margin-free prices using some metric (log-loss, mean-squared error, accuracy, etc) on their shared bets. Then, I use a weighted regression (as in footnote 5) to determine their relative ranks/values in this metric. Each book pair can be thought of as a head-to-head matchup, which makes the problem similar to ranking sports teams that play different schedules. This uses logic like "if A beats B, and B beats C, then A is likely to be better than C". Also, the fact that we have our own predictions for every bet helps because it allows us to leverage the full sample of each bookmaker. If Betcris' opening odds were more accurate than ours in their sample of 26K bets, while ours were more accurate than Pinnacle's in their sample of 26K bets, then we can be reasonably confident that Betcris' opening odds were more accurate than Pinnacle's.
While this method sounds good in theory, it didn't work that well in practice. For example, Betcris' opening odds were better (using the log-loss metric) when paired against every other bookmaker except Unibet and Pointsbet, where they were beaten by a pretty wide margin. The size of Betcris' overlapping samples with Unibet and Pointsbet were relatively small at 1870 and 1126 bets. These results are most likely just due to randomness, but they seemed to have an outsized effect on the results of the regression exercise (even when weighting observations by the underlying sample size). The choice of metric also mattered: Betcris was ranked first by log-loss, but only 4th when using accuracy.6 I think the fundamental issue with this exercise is simply that the sample sizes are too small. A few-thousand bet sample is nowhere near sufficient when trying to detect a 0.5% difference in accuracy between bookmakers.
Rather than scrap this section, I did an analysis similar to what was done in HSB1, where bookmakers were evaluated by using their margin-free prices to bet against other bookmakers' odds. A succinct way to summarize this betting exercise—in place of a table showing ROI by expected value bin—is to report the coefficients from a regression of bet outcome on the margin-free prices of each bookmaker. I do this for every pair of bookmakers using data from 2021 and 2022, normalizing the coefficients so that they add up to 1.7 This final table shows the results of this exercise for all of the pairs involving Betcris.
If Betcris' odds receive 100% of the weight, this means actual ROI should equal expected ROI when using Betcris' margin-free probabilities to bet. If Betcris' weight is 50%, ROI should sit halfway between expected ROI and the return from betting blindly.
Betcris' odds seemed to be the most predictive of any bookmaker in 2021-2022. Against books with the largest sample sizes—Pinnacle, Betonline, and Bovada—their opening prices were better by a wide margin. In HSB1, I came to the conclusion that Pinnacle had the best opening and closing prices. This apparent decline in the quality of Pinnacle's odds is surprising considering that in 2019-2020 Pinnacle posted their opening odds much earlier than in 2021-2022. However, it is important to stress that even with these seemingly large sample sizes, randomness still plays a role—something I appreciate more each time I revisit this data.
The next table summarizes the relationships (in 2022) between the margin-free opening and closing odds of the 5 bookmakers I think are the most interesting to look at (I would do all 11 but the table gets too big). As before, 3-balls are not included. The columns should be straightforward to interpret, but refer to section 3 in HSB1 for more details and some relevant discussion.
| book1 | book2 | correlation b/w opening odds |
correlation b/w closing odds |
overlapping sample size |
# of bets w/ 10% adv. |
fraction w/ 10% adv |
book1 -> book2 | book2 -> book1 |
|---|---|---|---|---|---|---|---|---|
| bet365 | betcris | 0.68 | 0.75 | 1644 | 221 | 13% | 0.14 | 0.08 |
| bet365 | betonline | 0.83 | 0.83 | 1818 | 100 | 6% | 0.16 | 0.12 |
| bet365 | draftkings | 0.94 | 0.96 | 2214 | 130 | 6% | 0.11 | 0.26 |
| bet365 | fanduel | 0.96 | 0.97 | 1814 | 81 | 4% | 0.16 | 0.15 |
| bet365 | pinnacle | 0.87 | 0.9 | 3112 | 299 | 10% | 0.16 | 0.24 |
| betcris | betonline | 0.75 | 0.92 | 4679 | 593 | 13% | 0.12 | 0.65 |
| betcris | draftkings | 0.73 | 0.84 | 1438 | 247 | 17% | 0.12 | 0.28 |
| betcris | fanduel | 0.77 | 0.87 | 1109 | 218 | 20% | 0.11 | 0.33 |
| betcris | pinnacle | 0.76 | 0.9 | 5259 | 618 | 12% | 0.16 | 0.53 |
| betonline | draftkings | 0.86 | 0.91 | 1473 | 101 | 7% | 0.25 | 0.35 |
| betonline | fanduel | 0.86 | 0.9 | 978 | 102 | 10% | 0.25 | 0.3 |
| betonline | pinnacle | 0.85 | 0.93 | 4469 | 177 | 4% | 0.54 | 0.36 |
| draftkings | fanduel | 0.94 | 0.96 | 1410 | 144 | 10% | 0.26 | 0.2 |
| draftkings | pinnacle | 0.89 | 0.93 | 2415 | 250 | 10% | 0.31 | 0.25 |
| fanduel | pinnacle | 0.9 | 0.94 | 1838 | 253 | 14% | 0.29 | 0.24 |
As mentioned in the previous section, raw correlations can be misleading. The most informative column for understanding how closely related two bookmakers' (opening) odds are is probably fraction with 10% adv., which shows how often the books' margin-free opening odds have a ratio of 1.1 or higher. The two rightmost columns show that all bookmakers' odds tend to move towards each other when their opening odds show large discrepancies. Betcris appears to have the most influence, but it's important to remember that they also post later than the other 4 bookmakers in this table, which means some of the movement towards Betcris prices might occur before their odds are actually posted.
When planning the roadmap of this post, I wanted to include a more complete analysis of the relative quality of bookmakers' odds than what I did for HSB1. Unfortunately, this turns out to be a difficult task. There are two main issues. First, because differences in the relative quality of books' prices are small, the sample sizes required to detect these differences need to be large. Second, bookmakers don't all offer the same matchups, which makes fair comparisons between books tricky and also reduces the effective sample sizes for making these comparisons.
As with the earlier method used to adjust books' correlations with our odds, the strategy for estimating relative bookmaker quality involves comparing the performance of pairs of bookmakers on the common set of bets they offer. For every pair of bookmakers (plus Data Golf), I evaluate the quality of their margin-free prices using some metric (log-loss, mean-squared error, accuracy, etc) on their shared bets. Then, I use a weighted regression (as in footnote 5) to determine their relative ranks/values in this metric. Each book pair can be thought of as a head-to-head matchup, which makes the problem similar to ranking sports teams that play different schedules. This uses logic like "if A beats B, and B beats C, then A is likely to be better than C". Also, the fact that we have our own predictions for every bet helps because it allows us to leverage the full sample of each bookmaker. If Betcris' opening odds were more accurate than ours in their sample of 26K bets, while ours were more accurate than Pinnacle's in their sample of 26K bets, then we can be reasonably confident that Betcris' opening odds were more accurate than Pinnacle's.
While this method sounds good in theory, it didn't work that well in practice. For example, Betcris' opening odds were better (using the log-loss metric) when paired against every other bookmaker except Unibet and Pointsbet, where they were beaten by a pretty wide margin. The size of Betcris' overlapping samples with Unibet and Pointsbet were relatively small at 1870 and 1126 bets. These results are most likely just due to randomness, but they seemed to have an outsized effect on the results of the regression exercise (even when weighting observations by the underlying sample size). The choice of metric also mattered: Betcris was ranked first by log-loss, but only 4th when using accuracy.6 I think the fundamental issue with this exercise is simply that the sample sizes are too small. A few-thousand bet sample is nowhere near sufficient when trying to detect a 0.5% difference in accuracy between bookmakers.
Rather than scrap this section, I did an analysis similar to what was done in HSB1, where bookmakers were evaluated by using their margin-free prices to bet against other bookmakers' odds. A succinct way to summarize this betting exercise—in place of a table showing ROI by expected value bin—is to report the coefficients from a regression of bet outcome on the margin-free prices of each bookmaker. I do this for every pair of bookmakers using data from 2021 and 2022, normalizing the coefficients so that they add up to 1.7 This final table shows the results of this exercise for all of the pairs involving Betcris.
| book2 | number of bets |
betcris open coefficient |
book2 open coefficient |
betcris close coefficient |
book2 close coefficient |
|---|---|---|---|---|---|
| pinnacle | 10996 | 0.97 | 0.03 | 0.75 | 0.25 |
| betonline | 9544 | 0.98 | 0.02 | 0.98 | 0.02 |
| bovada | 7215 | 0.92 | 0.08 | 0.90 | 0.10 |
| draftkings | 3141 | 0.54 | 0.46 | 0.61 | 0.39 |
| bet365 | 3121 | 0.81 | 0.19 | 0.63 | 0.37 |
| fanduel | 2236 | 0.65 | 0.35 | 0.60 | 0.40 |
| betmgm | 1987 | 0.81 | 0.19 | 0.97 | 0.03 |
| unibet | 1870 | 0.30 | 0.70 | 0.29 | 0.71 |
| pointsbet | 1126 | 0.02 | 0.98 | 0 | 1 |
| circa | 385 | 1 | 0 | 1 | 0 |
If Betcris' odds receive 100% of the weight, this means actual ROI should equal expected ROI when using Betcris' margin-free probabilities to bet. If Betcris' weight is 50%, ROI should sit halfway between expected ROI and the return from betting blindly.
Betcris' odds seemed to be the most predictive of any bookmaker in 2021-2022. Against books with the largest sample sizes—Pinnacle, Betonline, and Bovada—their opening prices were better by a wide margin. In HSB1, I came to the conclusion that Pinnacle had the best opening and closing prices. This apparent decline in the quality of Pinnacle's odds is surprising considering that in 2019-2020 Pinnacle posted their opening odds much earlier than in 2021-2022. However, it is important to stress that even with these seemingly large sample sizes, randomness still plays a role—something I appreciate more each time I revisit this data.