November 25, 2022
What makes Justin Thomas a great iron player?
Using strokes-gained, proximity, and GIR to analyze approach performance
Justin Thomas has been one of the
best approach
players on the PGA Tour for the last 5 years. That shouldn't come as news to anyone, but
the purpose of this blog post is to understand why Thomas has been so good.
Strokes-gained, which measures the quality of a shot relative to what we would expect from an average PGA Tour player,
is the benchmark for evaluating player performance on the PGA Tour. Because Thomas has been at or near
the top of the strokes-gained (approach) standings for the last 5 seasons, we know he's hitting his approach
shots in better spots and closer to the pin than his peers.
But while strokes-gained averages provide an incredibly useful, and simple, summary
of a player's performance, they also hide a lot of interesting information.
In this post we dig deeper into approach performance in two ways. First, we look at performance in different "bins" defined by distance
and lie (e.g. less than 100 yards from the fairway), and second, we make use of 4 additional stats that paint a picture
of why a golfer is gaining or losing strokes on their approaches.
These 4 stats are: adjusted proximity, adjusted GIR, good shot %,
and poor shot avoidance %.
We break approach performance into 6 bins: 4 bins for the fairway (50-100 yards, 100-150, 150-200, 200-250), and 2 for the non-fairway locations (50-150, 150-225). All shots in these distance ranges are included except those we've labelled as recovery shots. The table below shows Justin Thomas' strokes-gained per shot in each of the 6 bins over the last 2 years. (For a useful reference point, the best approach player in a season will typically gain around 1.1 strokes per round, which, assuming 18 approach shots/round, would translate to +0.06 SG per shot).
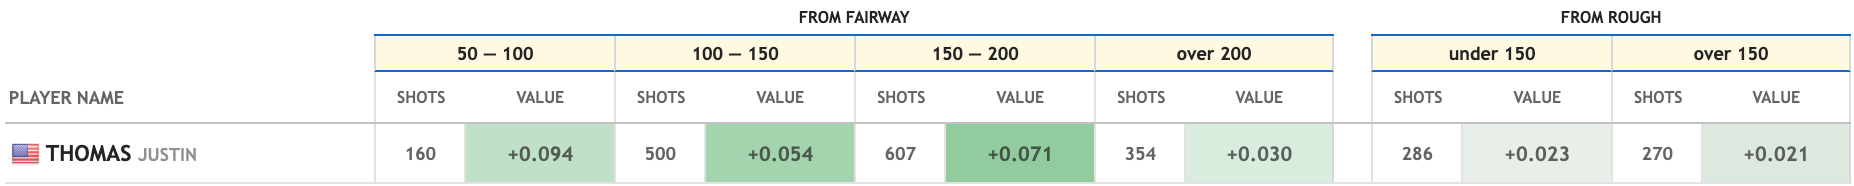
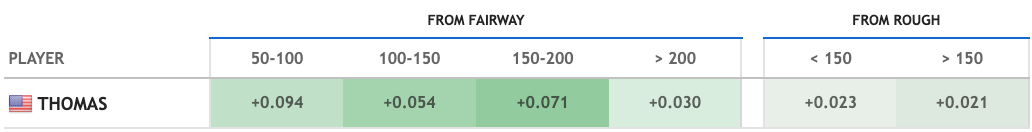
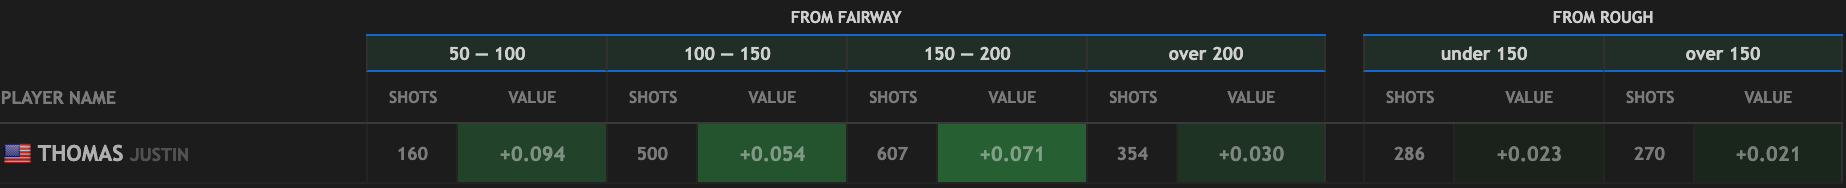
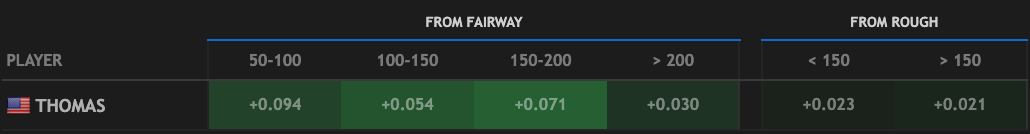 Thomas excels at approach shots from under 200 yards in the fairway,
which make up the majority of his approaches. Amongst players who hit enough shots to be eligible,
Thomas' percentile ranks (i.e. the percentage of players he was better than) in each
bin were 97th, 96th, 98th, 73rd, 72nd, and 68th.
This breakdown by approach distance is a step in the right direction,
but it still doesn't provide us with any additional insight into how Thomas gains his strokes.
That's where the 4 other stats come in.
Thomas excels at approach shots from under 200 yards in the fairway,
which make up the majority of his approaches. Amongst players who hit enough shots to be eligible,
Thomas' percentile ranks (i.e. the percentage of players he was better than) in each
bin were 97th, 96th, 98th, 73rd, 72nd, and 68th.
This breakdown by approach distance is a step in the right direction,
but it still doesn't provide us with any additional insight into how Thomas gains his strokes.
That's where the 4 other stats come in.
Much of the value that comes from analyzing golf data can be described as adjusting raw data for context. For example, raw scores from different tournaments aren't that useful as a measure of performance on their own, but true, or adjusted, strokes-gained gives us a measure of performance that can be directly compared regardless of the tournament or tour it came from. This is very powerful. It allows us to compare the quality of European Tour events to PGA Tour events, or to visualize how Jon Rahm's skill evolved from his amateur days up to now.
We can apply similar adjustments to more traditional statistics like driving distance, driving accuracy, and approach proximity—which we'll focus on momentarily. Among the traditional golf stats, raw proximity is probably the most misleading of the bunch. (Here I'm using proximity to mean average distance from the hole on approach shots from various distance bins. The undisputed leader in misleading golf stats is overall proximity.) There are two main reasons for this. First, the difficulty of approach shots varies considerably by round: in Round 3 of the 2022 RSM Classic the average proximity from 150-200 yards in the fairway was 41 feet, while in Round 4 at the 2022 Sony Open that same bucket yielded an average approach distance of just 25 feet. Second, and more importantly, there is a negative correlation between approach skill and average proximity across tournaments. That is, weaker approach players tend to play easier approach courses.
Using our adjusted proximity metric1, Collin Morikawa led the way in the 150-200 (Fairway) bin over the last 2 years at -4.95 feet. This means Morikawa hit it about 5 feet closer on average than what we would have expected from an average PGA Tour player hitting from his approach locations. At the other end of the spectrum, Martin Trainer was last in this bin averaging +5.3 feet. Comparing these differences to the average proximity numbers from specific rounds cited above, you can see why it's possible for differences in player skill to be swamped by differences in approach shot difficulty. The following table shows the top 15 players in adjusted proximity in the 150-200 Fairway bin over the last 2 years, along with their raw rank.
The biggest changes in raw to adjusted proximity ranks belong to golfers who mostly play tough courses, like Fleetwood (133 → 39), Westwood (116 → 33), and DeChambeau (97 → 31). The biggest movers in the opposite direction are players like Cameron Percy (42 → 108), Sam Ryder (31 → 82), and Vaughn Taylor (41 → 89).
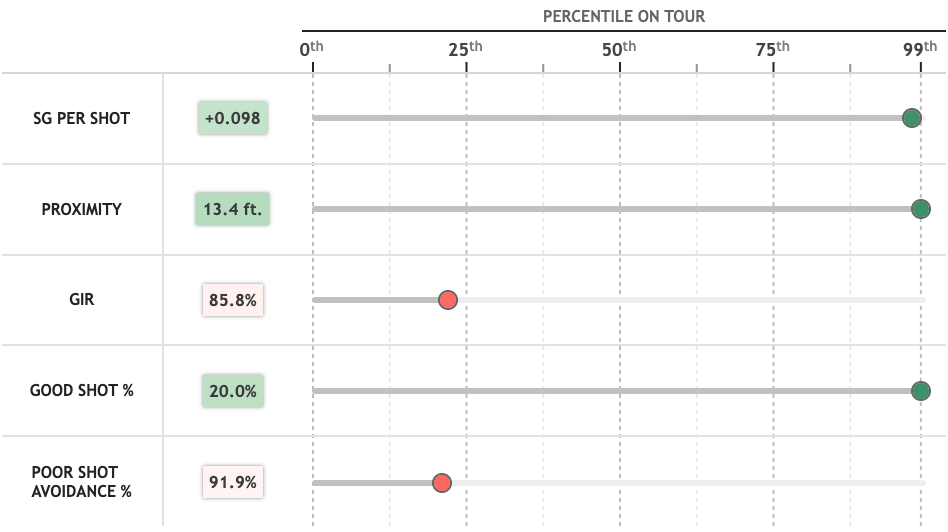
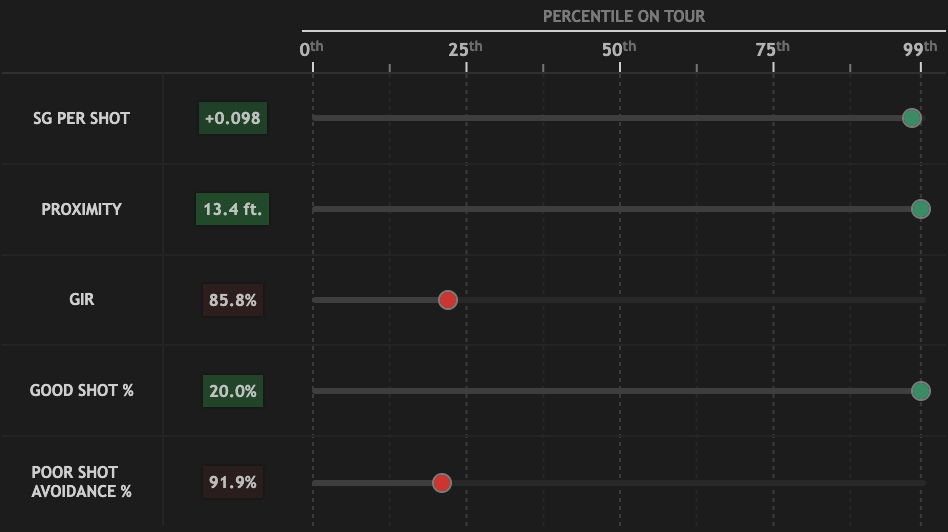
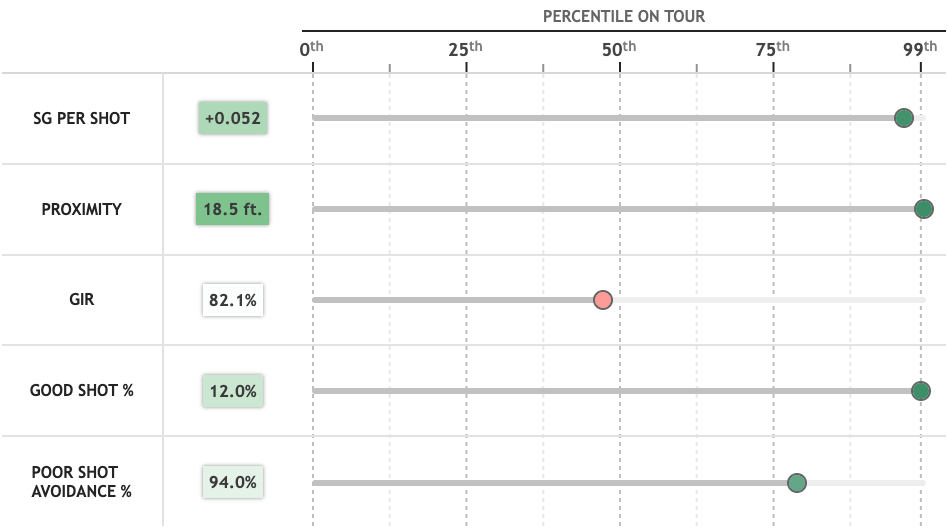
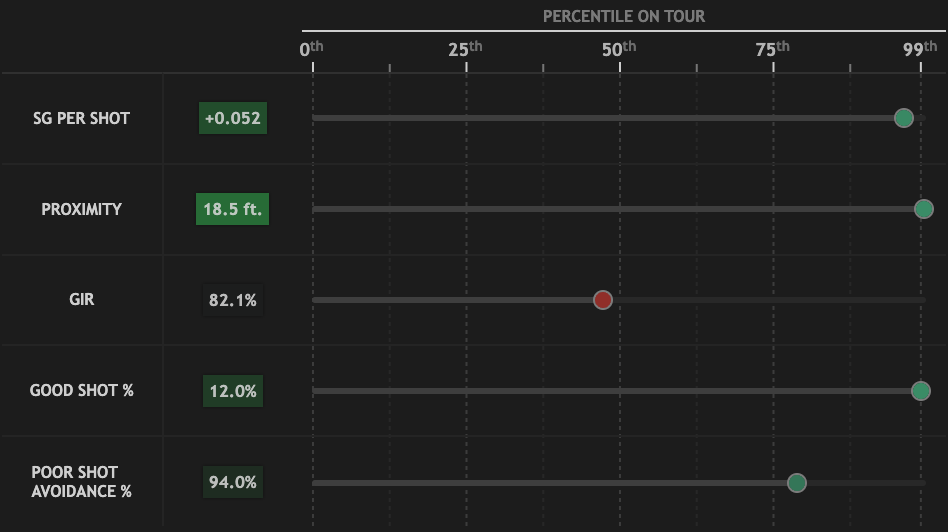
I'll quickly describe the other 3 stats before turning back to Thomas' data. Adjusted GIR2 measures how often a player hits the green on their approaches relative to their peers. For a given shot, if we estimate that an average player would hit the green 85% of the time from that location, hitting the green yields an adjusted GIR of 15% while missing yields a value of -85%. Good shot % is the fraction of shots a player hits that gain at least 0.5 strokes, and poor shot avoidance % is 1 minus the fraction of shots a player hits that lose at least 0.5 strokes. For adjusted proximity and GIR, we display values relative to the average raw proximity in each bin (e.g. Morikawa's adjusted proximity from 150-200 would be displayed as 26.5 feet, compared to the average value of 31.5 feet). The two plots below display Thomas' percentile rank in each of these stats for the 50-100 (Fairway) bin, and the 100-150 (Fairway) bin. Data is from the last 2 years.
 We can now give an answer to the question posed in the title. Justin Thomas is an elite iron player
because he hits a lot of great shots from shorter approach
distances. From 82 yards (the average distance of shots in the 50-100 bin), a shot that
gains 0.5 strokes at an average course
needs to be hit inside 5 feet—Thomas hit 32 of these in 160 shots over the last 2 years.
This 20% rate is double the tour average of 10%.
Thomas' ability to avoid hitting poor shots is not what makes him elite—in fact,
he has been well below average in that attribute over the last two seasons
in the 50-100 (Fairway) bin. These surprisingly low values for bad shot avoidance and adjusted
GIR are almost certainly in part due to statistical noise.
However, even after extending the sample back 5 years, we find that Thomas' great shot rate
is in a higher percentile than his bad shot avoidance in all 6 approach bins.
The data provides a pretty clear story for Thomas:
using a high risk, high reward strategy, he's become one of the best iron players in the world.
We can now give an answer to the question posed in the title. Justin Thomas is an elite iron player
because he hits a lot of great shots from shorter approach
distances. From 82 yards (the average distance of shots in the 50-100 bin), a shot that
gains 0.5 strokes at an average course
needs to be hit inside 5 feet—Thomas hit 32 of these in 160 shots over the last 2 years.
This 20% rate is double the tour average of 10%.
Thomas' ability to avoid hitting poor shots is not what makes him elite—in fact,
he has been well below average in that attribute over the last two seasons
in the 50-100 (Fairway) bin. These surprisingly low values for bad shot avoidance and adjusted
GIR are almost certainly in part due to statistical noise.
However, even after extending the sample back 5 years, we find that Thomas' great shot rate
is in a higher percentile than his bad shot avoidance in all 6 approach bins.
The data provides a pretty clear story for Thomas:
using a high risk, high reward strategy, he's become one of the best iron players in the world.
Our new approach page allows you to do this type of analysis for any player on the PGA Tour. It's a good way to quickly understand where a player excels in their approach game and why. Take Corey Conners, who appears to be the antithesis of Justin Thomas. Conners gains his strokes on longer approach shots, and does it largely by rarely hitting poor shots.
We break approach performance into 6 bins: 4 bins for the fairway (50-100 yards, 100-150, 150-200, 200-250), and 2 for the non-fairway locations (50-150, 150-225). All shots in these distance ranges are included except those we've labelled as recovery shots. The table below shows Justin Thomas' strokes-gained per shot in each of the 6 bins over the last 2 years. (For a useful reference point, the best approach player in a season will typically gain around 1.1 strokes per round, which, assuming 18 approach shots/round, would translate to +0.06 SG per shot).
Justin Thomas strokes-gained per shot—last two years
Much of the value that comes from analyzing golf data can be described as adjusting raw data for context. For example, raw scores from different tournaments aren't that useful as a measure of performance on their own, but true, or adjusted, strokes-gained gives us a measure of performance that can be directly compared regardless of the tournament or tour it came from. This is very powerful. It allows us to compare the quality of European Tour events to PGA Tour events, or to visualize how Jon Rahm's skill evolved from his amateur days up to now.
We can apply similar adjustments to more traditional statistics like driving distance, driving accuracy, and approach proximity—which we'll focus on momentarily. Among the traditional golf stats, raw proximity is probably the most misleading of the bunch. (Here I'm using proximity to mean average distance from the hole on approach shots from various distance bins. The undisputed leader in misleading golf stats is overall proximity.) There are two main reasons for this. First, the difficulty of approach shots varies considerably by round: in Round 3 of the 2022 RSM Classic the average proximity from 150-200 yards in the fairway was 41 feet, while in Round 4 at the 2022 Sony Open that same bucket yielded an average approach distance of just 25 feet. Second, and more importantly, there is a negative correlation between approach skill and average proximity across tournaments. That is, weaker approach players tend to play easier approach courses.
Using our adjusted proximity metric1, Collin Morikawa led the way in the 150-200 (Fairway) bin over the last 2 years at -4.95 feet. This means Morikawa hit it about 5 feet closer on average than what we would have expected from an average PGA Tour player hitting from his approach locations. At the other end of the spectrum, Martin Trainer was last in this bin averaging +5.3 feet. Comparing these differences to the average proximity numbers from specific rounds cited above, you can see why it's possible for differences in player skill to be swamped by differences in approach shot difficulty. The following table shows the top 15 players in adjusted proximity in the 150-200 Fairway bin over the last 2 years, along with their raw rank.
| Golfer | Adj Proximity | Adj Rank | Raw Proximity | Raw Rank | Shots Hit |
|---|---|---|---|---|---|
| Collin Morikawa | -4.95 | 1 | -4.48 | 1 | 700 |
| Paul Casey | -4.17 | 2 | -3.56 | 4 | 379 |
| Tony Finau | -3.88 | 3 | -3.69 | 3 | 758 |
| Kevin Na | -3.80 | 4 | -3.78 | 2 | 615 |
| Viktor Hovland | -3.60 | 5 | -2.59 | 13 | 673 |
| Justin Thomas | -3.53 | 6 | -2.96 | 8 | 607 |
| Abraham Ancer | -3.46 | 7 | -3.17 | 6 | 717 |
| Tom Hoge | -3.30 | 8 | -2.79 | 11 | 836 |
| Shane Lowry | -3.23 | 9 | -2.21 | 23 | 575 |
| Joaquin Niemann | -3.13 | 10 | -2.68 | 12 | 666 |
| Will Zalatoris | -2.91 | 11 | -2.08 | 27 | 590 |
| Jon Rahm | -2.89 | 12 | -1.78 | 44 | 596 |
| Cameron Smith | -2.81 | 13 | -1.96 | 33 | 574 |
| Justin Lower | -2.74 | 14 | -3.34 | 5 | 378 |
| Daniel Berger | -2.65 | 15 | -2.41 | 14 | 596 |
The biggest changes in raw to adjusted proximity ranks belong to golfers who mostly play tough courses, like Fleetwood (133 → 39), Westwood (116 → 33), and DeChambeau (97 → 31). The biggest movers in the opposite direction are players like Cameron Percy (42 → 108), Sam Ryder (31 → 82), and Vaughn Taylor (41 → 89).
I'll quickly describe the other 3 stats before turning back to Thomas' data. Adjusted GIR2 measures how often a player hits the green on their approaches relative to their peers. For a given shot, if we estimate that an average player would hit the green 85% of the time from that location, hitting the green yields an adjusted GIR of 15% while missing yields a value of -85%. Good shot % is the fraction of shots a player hits that gain at least 0.5 strokes, and poor shot avoidance % is 1 minus the fraction of shots a player hits that lose at least 0.5 strokes. For adjusted proximity and GIR, we display values relative to the average raw proximity in each bin (e.g. Morikawa's adjusted proximity from 150-200 would be displayed as 26.5 feet, compared to the average value of 31.5 feet). The two plots below display Thomas' percentile rank in each of these stats for the 50-100 (Fairway) bin, and the 100-150 (Fairway) bin. Data is from the last 2 years.
50—100 (Fairway)
100—150 (Fairway)
Our new approach page allows you to do this type of analysis for any player on the PGA Tour. It's a good way to quickly understand where a player excels in their approach game and why. Take Corey Conners, who appears to be the antithesis of Justin Thomas. Conners gains his strokes on longer approach shots, and does it largely by rarely hitting poor shots.
Bonus Section: How stable are these stats?
As we often emphasize on this website, there is a lot of "luck"—unexplained variation—in
golf performance. A rough method for estimating the skill
versus luck breakdown for some statistic is to look at its year-over-year correlation. Here we'll do
that for all combinations of the 5 statistics and 6 approach bins described above.
Instead of reporting correlations, which can be hard to interpret,
the table below displays the predicted percentile
for next season's performance given a 90th percentile performance in the current season.
It answers the question: "If a golfer performed better than 90% of his peers in some statistic
this season, what % of golfers do we expect them to be better than next season?"
If the variation in a statistic reflected only differences in skill,
then the predicted percentile would be 90%; if it
reflected only differences in luck, the predicted percentile would be 50%. In the more realistic
scenario of some mix of skill and luck, the predictions will lie somewhere between 50% and 90%.
Only seasons above the 60th percentile in shots hit for each distance bin were included in this exercise.
This resulted in an average sample size of 72 shots for bin 1, 235 shots for bin 2,
331 shots for bin 3, 151 shots for bin 4, 104 shots for bin 5, and 117 shots for bin 6.
Here are a few of my takeaways from the table:
Adjusted proximity is, by a wide margin, the most stable statistic year-over-year. Compared to strokes-gained, proximity has the advantage that it doesn't become non-linear around the hole: 15 feet versus 10 feet, and 10 feet versus 5 feet, is the same difference in terms of proximity, but they are different in units of strokes-gained (the difference between 10 and 5 feet is larger). Given that these two comparisons likely involve the same difference in skill, average proximity can be a better measure of approach skill.
Good shot % is the least stable of the 5 statistics, reflecting the fact that it's mostly luck whether your ball ends up close to the hole. However, good shot % in the shorter bins from the fairway is more predictive than in the others.
Poor shot avoidance % is fairly stable for longer shots from the fairway, but is less stable for short wedges and shots from the rough. Adjusted GIR follows a similar pattern to poor shot avoidance (which is not surprising because the two correlate strongly, especially for shorter distances).
The typical number of shots a player hits in each bin per season impacts stability (more shots = more stable), but it's far from the only determinant of stability. Adjusted proximity for the smallest sample size bin (50-100, Fairway) is much more predictive than good shot % in the largest sample size bin (150-200, Fairway).
The fact that there is a lot of variation across bins and statistics in their stability suggests that we can use these stats to better predict strokes-gained (which is ultimately the goal, as strokes-gained is the measure of performance in golf). Just as one example, focusing on bin 3 (150-200, Fairway), previous-season proximity is a better predictor of next-season strokes-gained than previous previous-season SG.
If you were in the 90th percentile this year, next year we would predict you to be in the...
FAIRWAY
ROUGH
50—100
100—150
150—200
> 200
< 150
> 150
SG PER SHOT
61st
68th
69th
60th
58th
59th
62nd
PROXIMITY
63rd
75th
81st
75th
61st
64th
70th
GIR
54th
61st
69th
62nd
54th
60th
60th
GOOD SHOT %
55th
59th
56th
53rd
53rd
55th
55th
POOR SHOT
AVOIDANCE %POOR SHOT AVOIDANCE %
AVOIDANCE %POOR SHOT AVOIDANCE %
58th
63rd
72nd
66th
53rd
58th
62nd
58th
65th
69th
63rd
56th
59th
Adjusted proximity is, by a wide margin, the most stable statistic year-over-year. Compared to strokes-gained, proximity has the advantage that it doesn't become non-linear around the hole: 15 feet versus 10 feet, and 10 feet versus 5 feet, is the same difference in terms of proximity, but they are different in units of strokes-gained (the difference between 10 and 5 feet is larger). Given that these two comparisons likely involve the same difference in skill, average proximity can be a better measure of approach skill.
Good shot % is the least stable of the 5 statistics, reflecting the fact that it's mostly luck whether your ball ends up close to the hole. However, good shot % in the shorter bins from the fairway is more predictive than in the others.
Poor shot avoidance % is fairly stable for longer shots from the fairway, but is less stable for short wedges and shots from the rough. Adjusted GIR follows a similar pattern to poor shot avoidance (which is not surprising because the two correlate strongly, especially for shorter distances).
The typical number of shots a player hits in each bin per season impacts stability (more shots = more stable), but it's far from the only determinant of stability. Adjusted proximity for the smallest sample size bin (50-100, Fairway) is much more predictive than good shot % in the largest sample size bin (150-200, Fairway).
The fact that there is a lot of variation across bins and statistics in their stability suggests that we can use these stats to better predict strokes-gained (which is ultimately the goal, as strokes-gained is the measure of performance in golf). Just as one example, focusing on bin 3 (150-200, Fairway), previous-season proximity is a better predictor of next-season strokes-gained than previous previous-season SG.