Sep 16, 2020
Sleeping on the lead: how do pros perform under pressure?
Competitive golf is compelling to watch in large part because it consistently
puts individual players under a direct pressure to perform. Winning
requires golfers to execute with the knowledge that the
outcome of the tournament hangs in the balance of their next few swings;
some players seem to
thrive under that pressure,
while others, well, don't.
In this blog post, we turn to the data to explore how golfers'
performance changes when they are in or around the lead of a tournament — that is,
when they are most likely to be feeling pressure.
The basic idea in this analysis is that we would like to compare a golfer's performance in pressure situations — or, what we imagine are pressure situations — to some baseline, or expected, performance level. Our expectation for each player in a given round comes from our predictive model of golfer performance. The predictions from this model are constructed using each golfer's historical performance (as measured by the true strokes-gained metric), with some additional adjustments made for the specific course being played. One output from the model is what we call a golfer's skill level, which is our expectation for their performance in their next round, and is conveniently stated in units of strokes-gained relative to an average PGA Tour field; another output is a golfer’s win probability at any point in the progression of the tournament. Both of these outputs will be used as baselines in assessing golfer performance under pressure.
Importantly, this model makes no adjustment for a player's starting position before a given round. Therefore, to understand the effect that "pressure" might have on golfers, we can look at how their performance deviates from our model's expectation when they are near the lead. The plot below does exactly this, displaying the average strokes-gained relative to expectation by a golfer's final round starting position, along with a fitted curve:
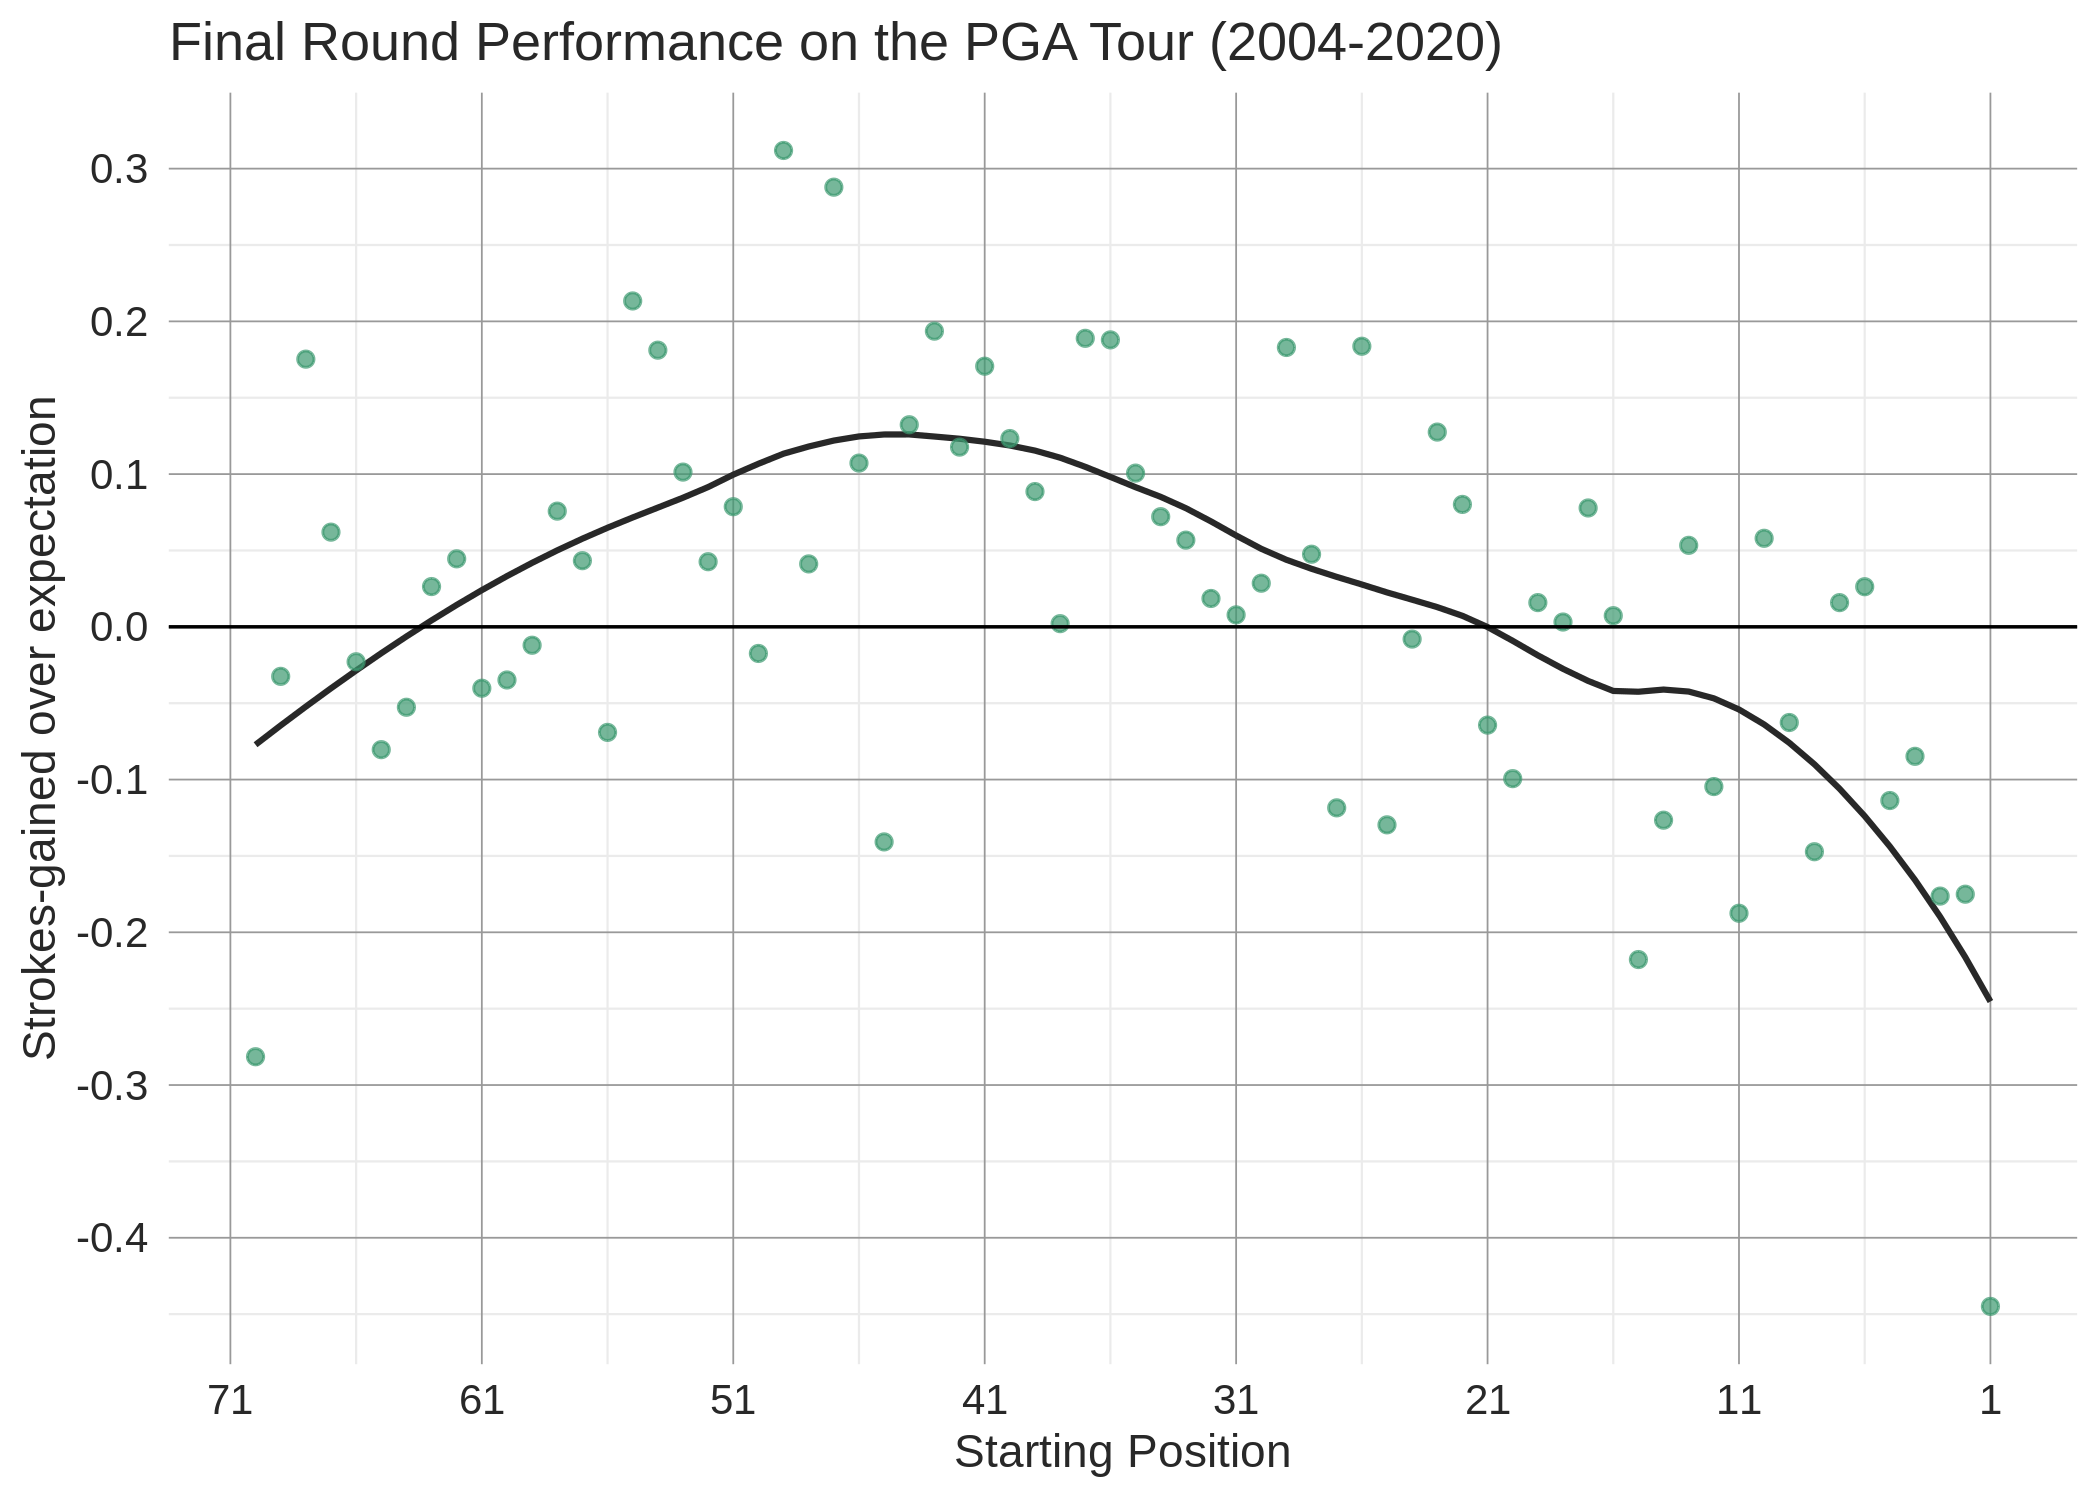
 Besides the general trend, there are a few things to note.
First, final round leaders have on average performed a
whopping 0.44 strokes below expectation! Second, this is strokes-gained relative to our model's
expectation — our model does not adjust for differential course conditions in
the morning and afternoon, so that is not accounted for. It's likely that
scoring conditions are slightly more difficult on average later in the day.
Third, recall that strokes-gained is a relative measure,
which means the average strokes-gained
over expectation is zero across all players in a given round.
Therefore, given that the leaders are
underperforming in final rounds, it has to be the case that the
rest of the field is overperforming [1]. Fourth,
also of interest is the
same plot for
third rounds on the PGA Tour; the trend is broadly similar, except we don't see the underperformance
from golfers starting their third rounds at the bottom of the leaderboard.
(The reader is asked to insert their narrative of choice here.)
Besides the general trend, there are a few things to note.
First, final round leaders have on average performed a
whopping 0.44 strokes below expectation! Second, this is strokes-gained relative to our model's
expectation — our model does not adjust for differential course conditions in
the morning and afternoon, so that is not accounted for. It's likely that
scoring conditions are slightly more difficult on average later in the day.
Third, recall that strokes-gained is a relative measure,
which means the average strokes-gained
over expectation is zero across all players in a given round.
Therefore, given that the leaders are
underperforming in final rounds, it has to be the case that the
rest of the field is overperforming [1]. Fourth,
also of interest is the
same plot for
third rounds on the PGA Tour; the trend is broadly similar, except we don't see the underperformance
from golfers starting their third rounds at the bottom of the leaderboard.
(The reader is asked to insert their narrative of choice here.)
While the aggregate trend is interesting, we can do much better: this interactive tool allows you to explore the relationship between starting position — in rounds 3 or 4 — and performance for individual golfers on the PGA, European, and Korn Ferry tours since 2004. It's worth stating that this analysis is descriptive and not predictive — it tells us how players have performed in the past, but not necessarily how we expect them to perform in the future. For that, further analysis is required.
We characterize final round performances using two types of metrics: strokes-gained and win probability. To understand how we use each of these metrics, let's consider the specific example of Tiger Woods' performance in the final round of the 2019 Masters. Tiger started this Sunday in a tie for second with Tony Finau, 2 strokes back of leader Francesco Molinari. First, consider the performance through the lens of strokes-gained. Our estimate of Tiger's skill level to begin that day was +1.66 — that is, 1.66 strokes better than the average PGA Tour field. However, the average skill level of the field that Sunday at Augusta was +0.79, meaning we only expected Tiger to beat the field by 0.87 strokes. Ultimately Tiger shot 70 to the field's average of 71.47, which equates to a performance relative to expectation of +0.59. These numbers are, hopefully, straightforward to understand; next we consider our win probability metric, which has some nuance in its interpretation.
Tiger began the day with a 16% chance of winning according to our model. The question we try to answer with our win probability metric is, "Did Tiger's performance on Sunday increase or decrease his probability of winning from its pre-round level?" If that sounds silly, given that we know Tiger did in fact win, bear with us. Tiger beat the field by 1.47 strokes that day; the question we ask is, without knowledge of how the rest of the contenders played, how likely is it that Tiger's score was good enough to win? The answer, in Tiger's case, is just 5.1%. This should make sense: Tiger began the day 2 strokes back of the lead on a bunched leaderboard; without knowing how Molinari or the other pursuers played, it is unlikely that gaining just 1.5 strokes over the field average would be enough for Tiger to get the win. We call this metric "conditional expected wins", because we are conditioning on the golfer's final round performance and then estimating their win probability. This metric is useful for two reasons. First, it provides an indication of how a player arrived at their win: was it due to their own performance on Sunday, or was it due to the (poor) performance of other players? In Tiger's case, it's clear that he was lucky, in some sense, to secure the win given his pedestrian final round performance. Second, it provides another metric for evaluating whether a golfer has under or over-performed in final rounds: given that Tiger's win probability was 16% pre-round and just 5% after we knew his strokes-gained that day, we can say that he underperformed his win expectation. (See [2] for more details.) Therefore, interestingly, Tiger overperformed his strokes-gained expectation but underperformed his win expectation that Sunday at Augusta. This is possible because winning from Tiger's position to start the day requires a very good performance — more generally, a golfer who plays consistently solid on Sundays when in contention, but does not have any great performances, will tend to underperform their win expectation even if they are slightly overperforming their strokes-gained expectation. Let's now consider one such golfer.
Since winning the Puerto Rico Open in March of 2016, Tony Finau has put himself in a position to win on numerous occasions but has failed to secure that next victory. Is this winless drought mainly due to poor play on Finau's part, or has he just been beat by great performances from other players? Conditional expected wins can provide an answer. We estimated that Finau would win 3.1 times during this stretch based on his position on the leaderboard through the penultimate round (this is simply the sum of Finau's pre-final round win probabilities from our live predictive model). After taking into account Finau's final round performances, that expected win figure drops to 1.9 — that is, without knowing how the rest of the field performed in these final rounds, our model predicted 1.9 wins for Finau. Therefore, while Finau has underperformed his win expectation, he has also been unlucky not to win. At the event level, the highest conditional expected win value for Finau came at the 2019 WGC-HSBC Champions, where he started the final round tied for the lead, shot 71 (beating the field average by 3.38 strokes), but ultimately lost to Xander Schauffele in a playoff. Our model gave Finau a 90% chance of winning given that he beat the field by 3.38 strokes that day. From a strokes-gained perspective, in this 4-year stretch Finau has played right around our model's expectation when he has been near the lead heading into the final round; this is considerably better than the tour average (-0.44 strokes below expectation when leading). Therefore, the story behind Finau's lack of wins appears to be a combination of playing solid but not producing any exceptional final round performances, as well as enduring a few tough beats after playing well enough to win.
The table below shows pre-round expected wins, conditional expected wins, and actual wins for three different groups of players: 1) The best and worst final round performers (conditional expected wins minus pre-round expected wins), 2) The luckiest and unluckiest (actual wins minus conditional expected wins), and 3) The 20 winningest golfers since 2004 (with the restriction that at least 2 of those wins be on the PGA Tour).
There are many interesting takeaways from this table, but let's
focus on the elephant in the room: it appears that Tiger has been very lucky
to win as much as he has since 2004. At the start of his final rounds since 2004, our model
estimated that Tiger could expect 30.6 wins. Conditional on the final round scores
Tiger actually shot,
and without knowing his competitors' scores, we predicted 33.2 wins for Tiger. This means
that Tiger overperformed our model's win expectation (which, again, makes no adjustment for
a player's final round starting position in forming its predictions). Ultimately Tiger ended up
with 43 wins in this stretch, meaning that he got an additional 9.8 wins due
to factors seemingly out of his control (i.e. how his competitors played in these final rounds).
Now, before the Tiger devotees
deride this analysis, I'll mention a few things. First, as is detailed in the next
paragraph, our estimate of conditional expected wins is systematically biased
downwards. Second, the fact that Tiger's actual win total is so much higher than
his conditional expected win total means that other players who were in contention with Tiger
tended to play poorly; anecdotally this seemed to be true, and we actually wrote
an old blog post that
attempted to quantify the Tiger Effect. Third, if a player has a large lead with
a few holes remaining they can afford to play conservatively and give up a stroke or two;
this could lead some of Tiger's final round strokes-gained numbers to be artificially lower.
However, these thoughts notwithstanding, simply looking through the
data behind some of Tiger's wins
makes a compelling case that he's probably won more than he should have.
As mentioned above, conditional expected wins are on average slightly lower than pre-round expected wins (and actual wins). This is easily explained given the patterns in the position-performance relationship documented above. Players near the lead tend to underperform the model's expectation, which leads us to overestimate the total strokes-gained over the field required to win a tournament. For example, in the case of Tiger at the 2019 Masters, we underestimate how likely it is that -13 wins the tournament, because the model does not account for the expected underperformance of Molinari and other contenders. This is important to keep in mind when analyzing a specific golfer's metrics: performing in line with the model's expectation (of strokes-gained when near the lead, or win probability) is better than the tour average in these situations.
We'll conclude with some information relevant to this week's tournament, the U.S. Open. Shown below is the same plot from the introduction, except with the sample restricted to major championships since 2004:
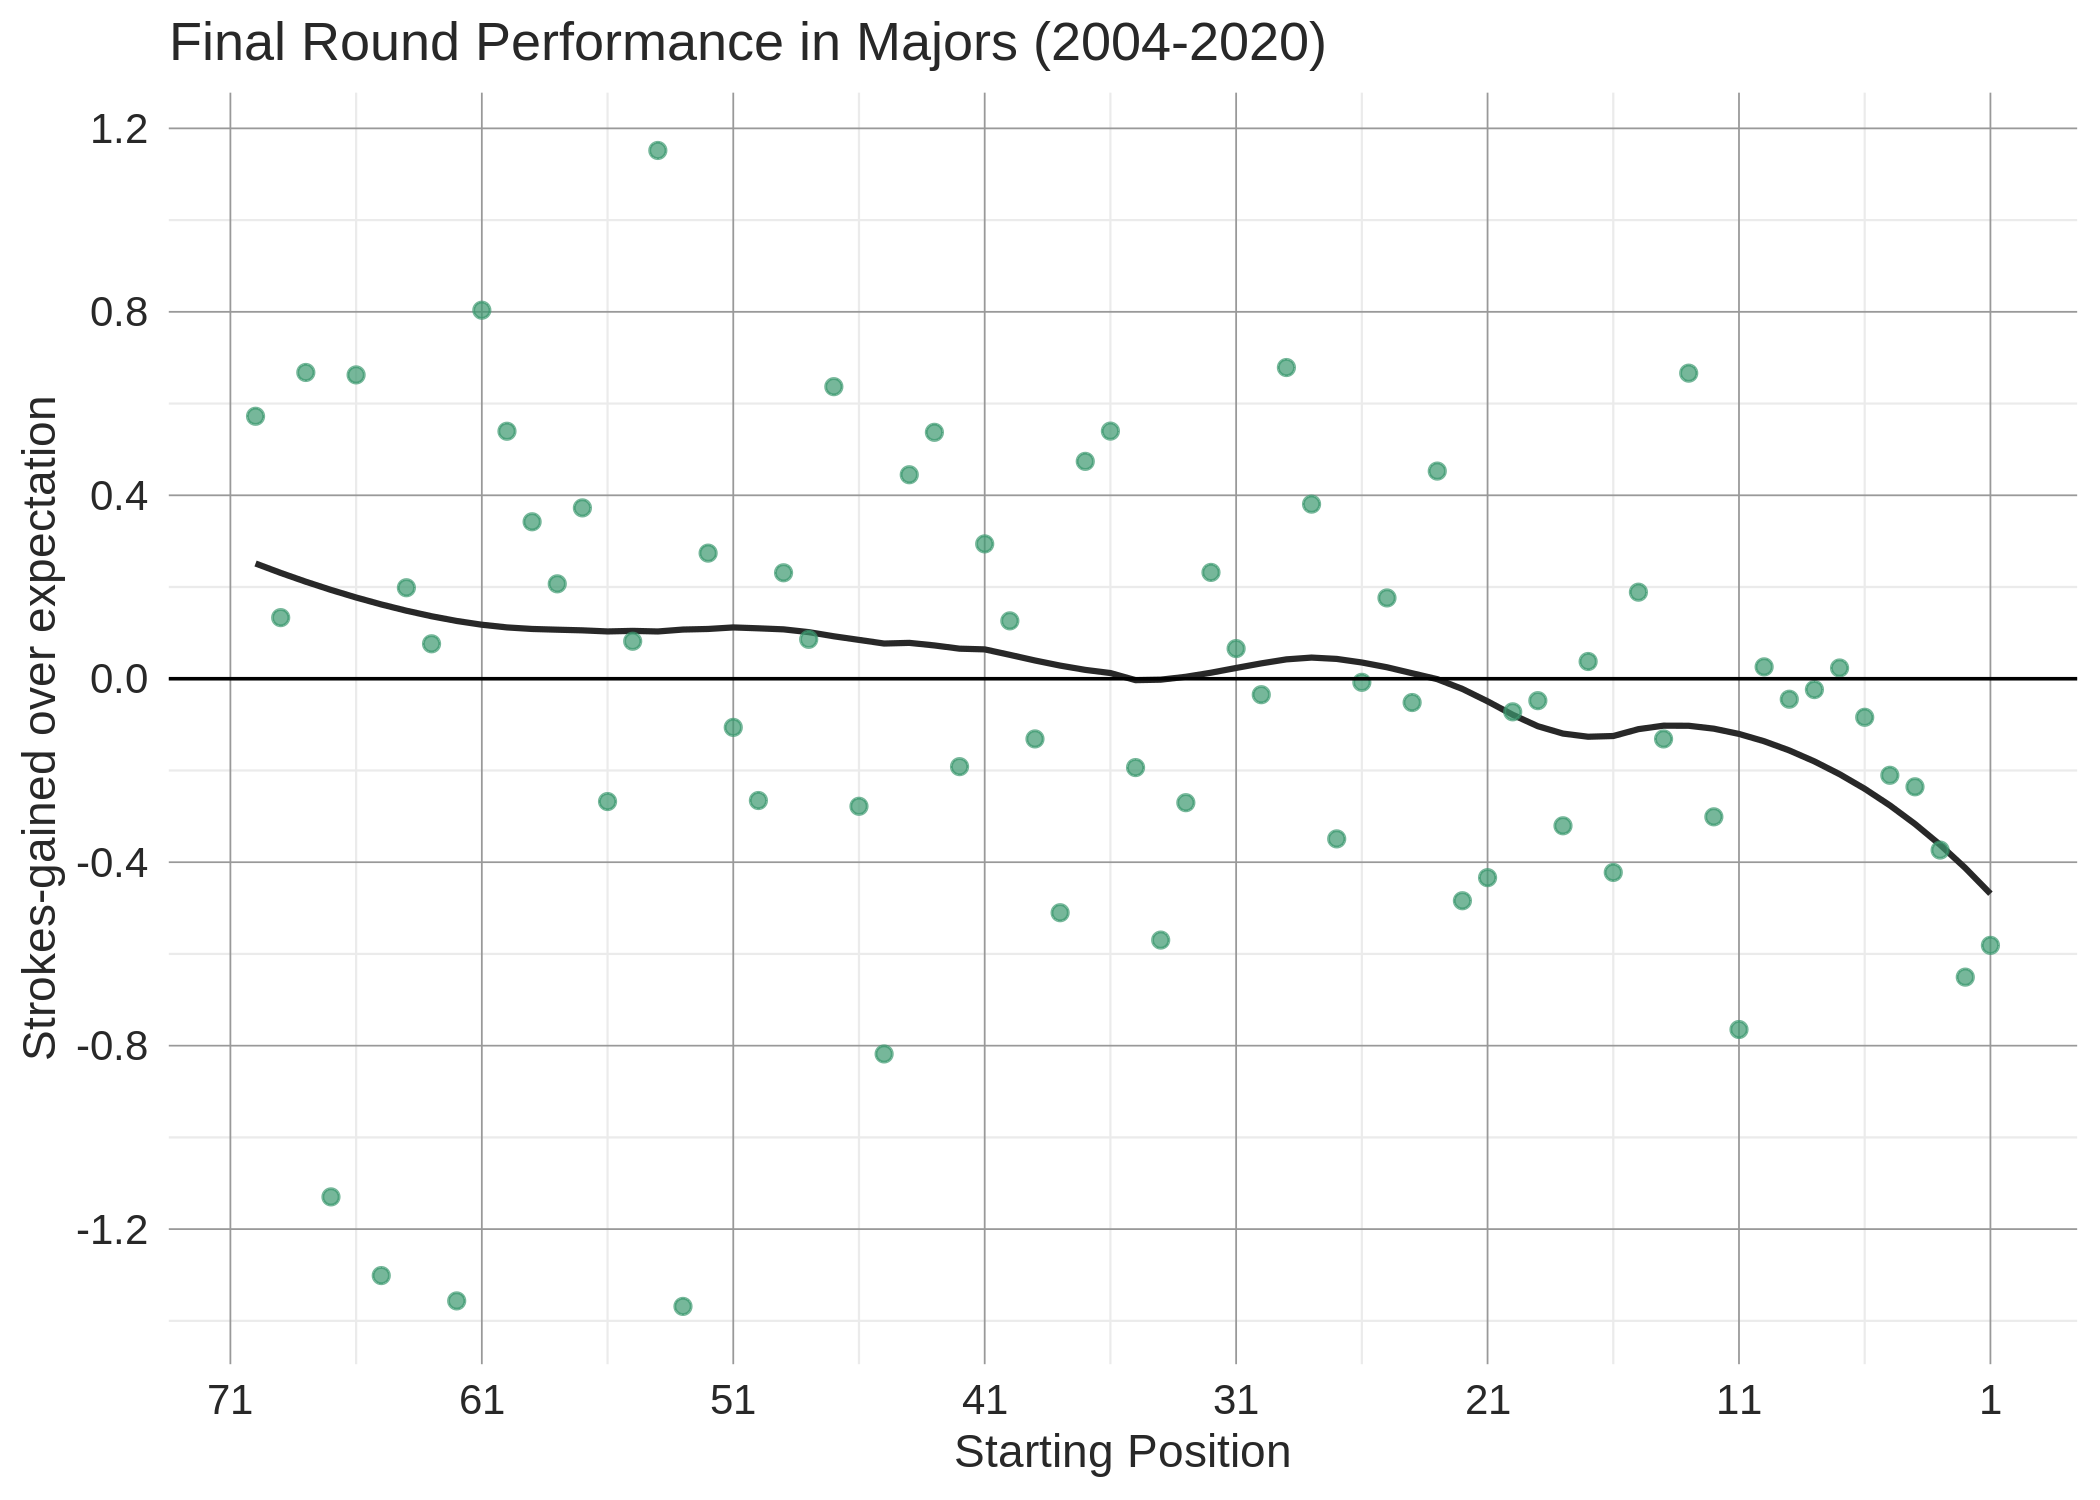
 Players starting the final round of a major championship
in 5th place or better have on average performed 0.4 strokes per round
below expectation. This is a substantially greater underperformance
than that seen from the leaders of regular PGA Tour events; however,
it should be interpreted with caution as it is a relatively small
sample size (65 majors). Given the steady downward slope,
it's possible that changing course conditions play a larger role in
weekend rounds of majors (but, conditions alone can't explain the magnitude
of this trend). The plot for third round performance in
major championships does not show a similar decline in performance when starting
near the lead, which is surprising and may speak to the smaller sample size.
Players starting the final round of a major championship
in 5th place or better have on average performed 0.4 strokes per round
below expectation. This is a substantially greater underperformance
than that seen from the leaders of regular PGA Tour events; however,
it should be interpreted with caution as it is a relatively small
sample size (65 majors). Given the steady downward slope,
it's possible that changing course conditions play a larger role in
weekend rounds of majors (but, conditions alone can't explain the magnitude
of this trend). The plot for third round performance in
major championships does not show a similar decline in performance when starting
near the lead, which is surprising and may speak to the smaller sample size.
Given the findings we've documented here it's clear that a player's starting position in weekend rounds needs to be incorporated into our predictive model — and will be in the coming weeks (update: it's now included). The effect of this addition will be clear for our live predictive model — the leaders' win probabilities will decline — but it will also matter for pre-tournament predictions: better golfers (who are more likely to be leading through rounds 3 and 4) will be less likely to win. Interestingly then, given that final round leaders in majors have historically performed worse than leaders of normal PGA Tour events, this analysis lends some credence to the claim that majors are in fact harder to win.
The basic idea in this analysis is that we would like to compare a golfer's performance in pressure situations — or, what we imagine are pressure situations — to some baseline, or expected, performance level. Our expectation for each player in a given round comes from our predictive model of golfer performance. The predictions from this model are constructed using each golfer's historical performance (as measured by the true strokes-gained metric), with some additional adjustments made for the specific course being played. One output from the model is what we call a golfer's skill level, which is our expectation for their performance in their next round, and is conveniently stated in units of strokes-gained relative to an average PGA Tour field; another output is a golfer’s win probability at any point in the progression of the tournament. Both of these outputs will be used as baselines in assessing golfer performance under pressure.
Importantly, this model makes no adjustment for a player's starting position before a given round. Therefore, to understand the effect that "pressure" might have on golfers, we can look at how their performance deviates from our model's expectation when they are near the lead. The plot below does exactly this, displaying the average strokes-gained relative to expectation by a golfer's final round starting position, along with a fitted curve:
While the aggregate trend is interesting, we can do much better: this interactive tool allows you to explore the relationship between starting position — in rounds 3 or 4 — and performance for individual golfers on the PGA, European, and Korn Ferry tours since 2004. It's worth stating that this analysis is descriptive and not predictive — it tells us how players have performed in the past, but not necessarily how we expect them to perform in the future. For that, further analysis is required.
We characterize final round performances using two types of metrics: strokes-gained and win probability. To understand how we use each of these metrics, let's consider the specific example of Tiger Woods' performance in the final round of the 2019 Masters. Tiger started this Sunday in a tie for second with Tony Finau, 2 strokes back of leader Francesco Molinari. First, consider the performance through the lens of strokes-gained. Our estimate of Tiger's skill level to begin that day was +1.66 — that is, 1.66 strokes better than the average PGA Tour field. However, the average skill level of the field that Sunday at Augusta was +0.79, meaning we only expected Tiger to beat the field by 0.87 strokes. Ultimately Tiger shot 70 to the field's average of 71.47, which equates to a performance relative to expectation of +0.59. These numbers are, hopefully, straightforward to understand; next we consider our win probability metric, which has some nuance in its interpretation.
Tiger began the day with a 16% chance of winning according to our model. The question we try to answer with our win probability metric is, "Did Tiger's performance on Sunday increase or decrease his probability of winning from its pre-round level?" If that sounds silly, given that we know Tiger did in fact win, bear with us. Tiger beat the field by 1.47 strokes that day; the question we ask is, without knowledge of how the rest of the contenders played, how likely is it that Tiger's score was good enough to win? The answer, in Tiger's case, is just 5.1%. This should make sense: Tiger began the day 2 strokes back of the lead on a bunched leaderboard; without knowing how Molinari or the other pursuers played, it is unlikely that gaining just 1.5 strokes over the field average would be enough for Tiger to get the win. We call this metric "conditional expected wins", because we are conditioning on the golfer's final round performance and then estimating their win probability. This metric is useful for two reasons. First, it provides an indication of how a player arrived at their win: was it due to their own performance on Sunday, or was it due to the (poor) performance of other players? In Tiger's case, it's clear that he was lucky, in some sense, to secure the win given his pedestrian final round performance. Second, it provides another metric for evaluating whether a golfer has under or over-performed in final rounds: given that Tiger's win probability was 16% pre-round and just 5% after we knew his strokes-gained that day, we can say that he underperformed his win expectation. (See [2] for more details.) Therefore, interestingly, Tiger overperformed his strokes-gained expectation but underperformed his win expectation that Sunday at Augusta. This is possible because winning from Tiger's position to start the day requires a very good performance — more generally, a golfer who plays consistently solid on Sundays when in contention, but does not have any great performances, will tend to underperform their win expectation even if they are slightly overperforming their strokes-gained expectation. Let's now consider one such golfer.
Since winning the Puerto Rico Open in March of 2016, Tony Finau has put himself in a position to win on numerous occasions but has failed to secure that next victory. Is this winless drought mainly due to poor play on Finau's part, or has he just been beat by great performances from other players? Conditional expected wins can provide an answer. We estimated that Finau would win 3.1 times during this stretch based on his position on the leaderboard through the penultimate round (this is simply the sum of Finau's pre-final round win probabilities from our live predictive model). After taking into account Finau's final round performances, that expected win figure drops to 1.9 — that is, without knowing how the rest of the field performed in these final rounds, our model predicted 1.9 wins for Finau. Therefore, while Finau has underperformed his win expectation, he has also been unlucky not to win. At the event level, the highest conditional expected win value for Finau came at the 2019 WGC-HSBC Champions, where he started the final round tied for the lead, shot 71 (beating the field average by 3.38 strokes), but ultimately lost to Xander Schauffele in a playoff. Our model gave Finau a 90% chance of winning given that he beat the field by 3.38 strokes that day. From a strokes-gained perspective, in this 4-year stretch Finau has played right around our model's expectation when he has been near the lead heading into the final round; this is considerably better than the tour average (-0.44 strokes below expectation when leading). Therefore, the story behind Finau's lack of wins appears to be a combination of playing solid but not producing any exceptional final round performances, as well as enduring a few tough beats after playing well enough to win.
While our interactive pressure
tool allows you to dig in to the performance of specific players, it is always interesting
to see a list of outlier performers. Next we highlight some of the best — and worst —
final round performers according to both the strokes-gained and win
probability metrics. First up is strokes-gained; the table below, which is updated
along with the interactive tool each week,
shows the 20 best and worst players for each final round starting position (with
the requirement that at least 30% of rounds are from PGA Tour events):
In our opinion expected wins are a much more interesting (but perhaps not very useful) metric.
As was eluded to earlier,
we can compare a golfer's conditional expected wins to their pre-round expected wins
to assess whether they have under or over-performed in final rounds.
We can also compare their conditional expected wins to their actual wins to assess how
many wins a golfer "deserved" based on their final round performances — this difference is referred to
as "luck" in what follows.
SELECT FINAL ROUND START POSITION
20 BEST PERFORMERS
PLAYER
ROUNDS
SG VS EXPECTED
20 WORST PERFORMERS
PLAYER
ROUNDS
SG VS EXPECTED
The table below shows pre-round expected wins, conditional expected wins, and actual wins for three different groups of players: 1) The best and worst final round performers (conditional expected wins minus pre-round expected wins), 2) The luckiest and unluckiest (actual wins minus conditional expected wins), and 3) The 20 winningest golfers since 2004 (with the restriction that at least 2 of those wins be on the PGA Tour).
SHOW TOP/BOTTOM PLAYERS BY
20 BEST PERFORMERS
EXPECTED WINS
PLAYER
PRE-ROUND
CONDITIONAL
DIFF
WINS
"LUCK"
20 WORST PERFORMERS
EXPECTED WINS
PLAYER
PRE-ROUND
CONDITIONAL
DIFF
WINS
"LUCK"
As mentioned above, conditional expected wins are on average slightly lower than pre-round expected wins (and actual wins). This is easily explained given the patterns in the position-performance relationship documented above. Players near the lead tend to underperform the model's expectation, which leads us to overestimate the total strokes-gained over the field required to win a tournament. For example, in the case of Tiger at the 2019 Masters, we underestimate how likely it is that -13 wins the tournament, because the model does not account for the expected underperformance of Molinari and other contenders. This is important to keep in mind when analyzing a specific golfer's metrics: performing in line with the model's expectation (of strokes-gained when near the lead, or win probability) is better than the tour average in these situations.
We'll conclude with some information relevant to this week's tournament, the U.S. Open. Shown below is the same plot from the introduction, except with the sample restricted to major championships since 2004:
Given the findings we've documented here it's clear that a player's starting position in weekend rounds needs to be incorporated into our predictive model — and will be in the coming weeks (update: it's now included). The effect of this addition will be clear for our live predictive model — the leaders' win probabilities will decline — but it will also matter for pre-tournament predictions: better golfers (who are more likely to be leading through rounds 3 and 4) will be less likely to win. Interestingly then, given that final round leaders in majors have historically performed worse than leaders of normal PGA Tour events, this analysis lends some credence to the claim that majors are in fact harder to win.