PUBLISHED January 6, 2020
Inside The Numbers ...
is a brief numerical summary of the current happenings in the world golf, published every Monday — hopefully.
0.8% WIN PROBABILITY
Standing on the 18th tee in the final round of the Sentry Tournament of Champions, our model gave Patrick Reed a slim 0.8% chance of winning the tournament. Even after he birdied 18 to get in the house at 14-under (2 shots behind Justin Thomas at the time), he was still only given a 0.9% shot. Luckily for Reed, Thomas proceeded to bogey two of his last 3 holes (-1.95 strokes-gained to the field), which, along with Schauffele’s uninspiring finish, let Reed into a 3-way playoff where his win probability was roughly 33%. Much to the dismay of the golf world, the fan favourite couldn’t complete the comeback, eventually losing out to Thomas on the 3rd playoff hole.
-0.21 STROKES PER ROUND
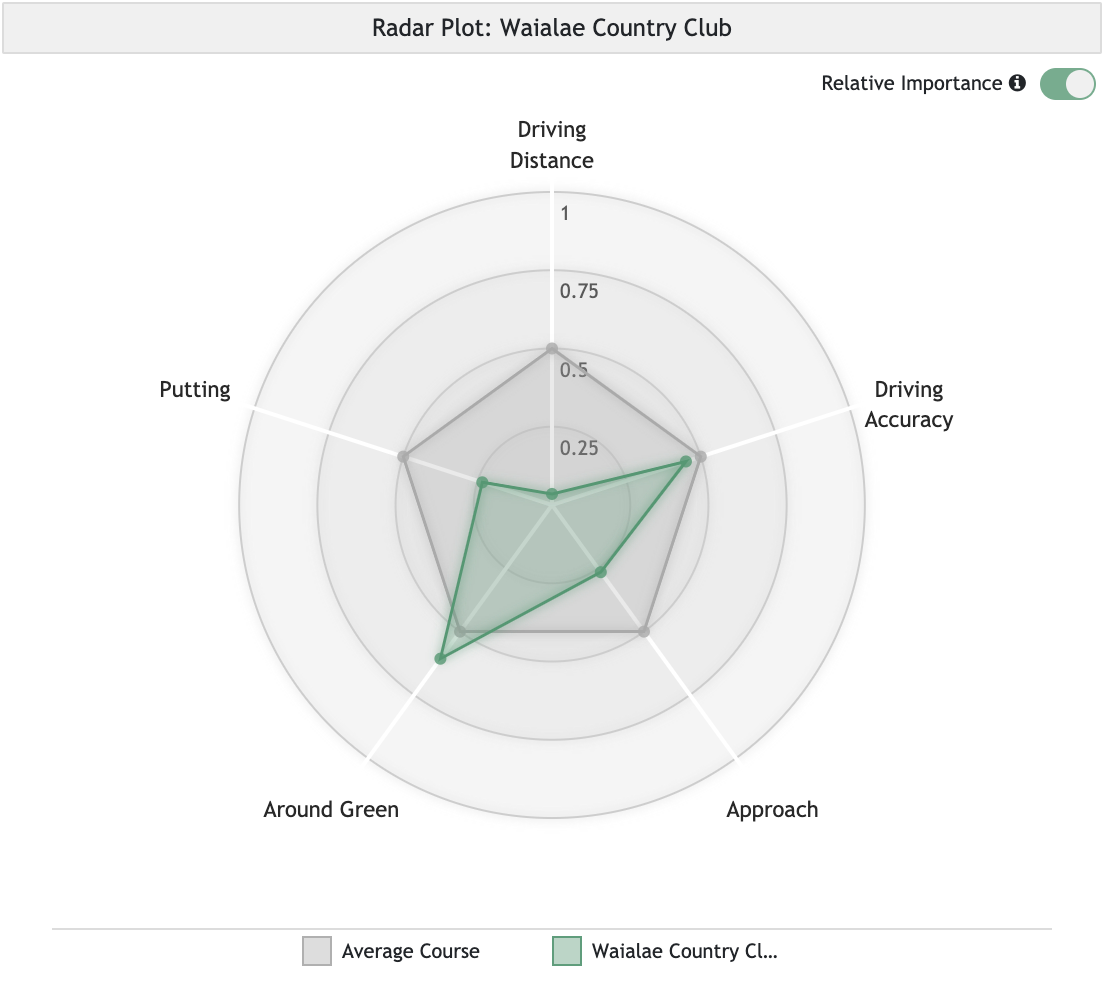
Despite being the model favourite this week, Justin Thomas is receiving the largest negative adjustment (-0.21 strokes per round) due to his course fit, or lack thereof, at Waialae CC.
The negative bump is driven by the fact that driving distance is a relatively weak predictor of success at Waialae, an attribute that Thomas typically benefits from week-to-week on the PGA Tour.
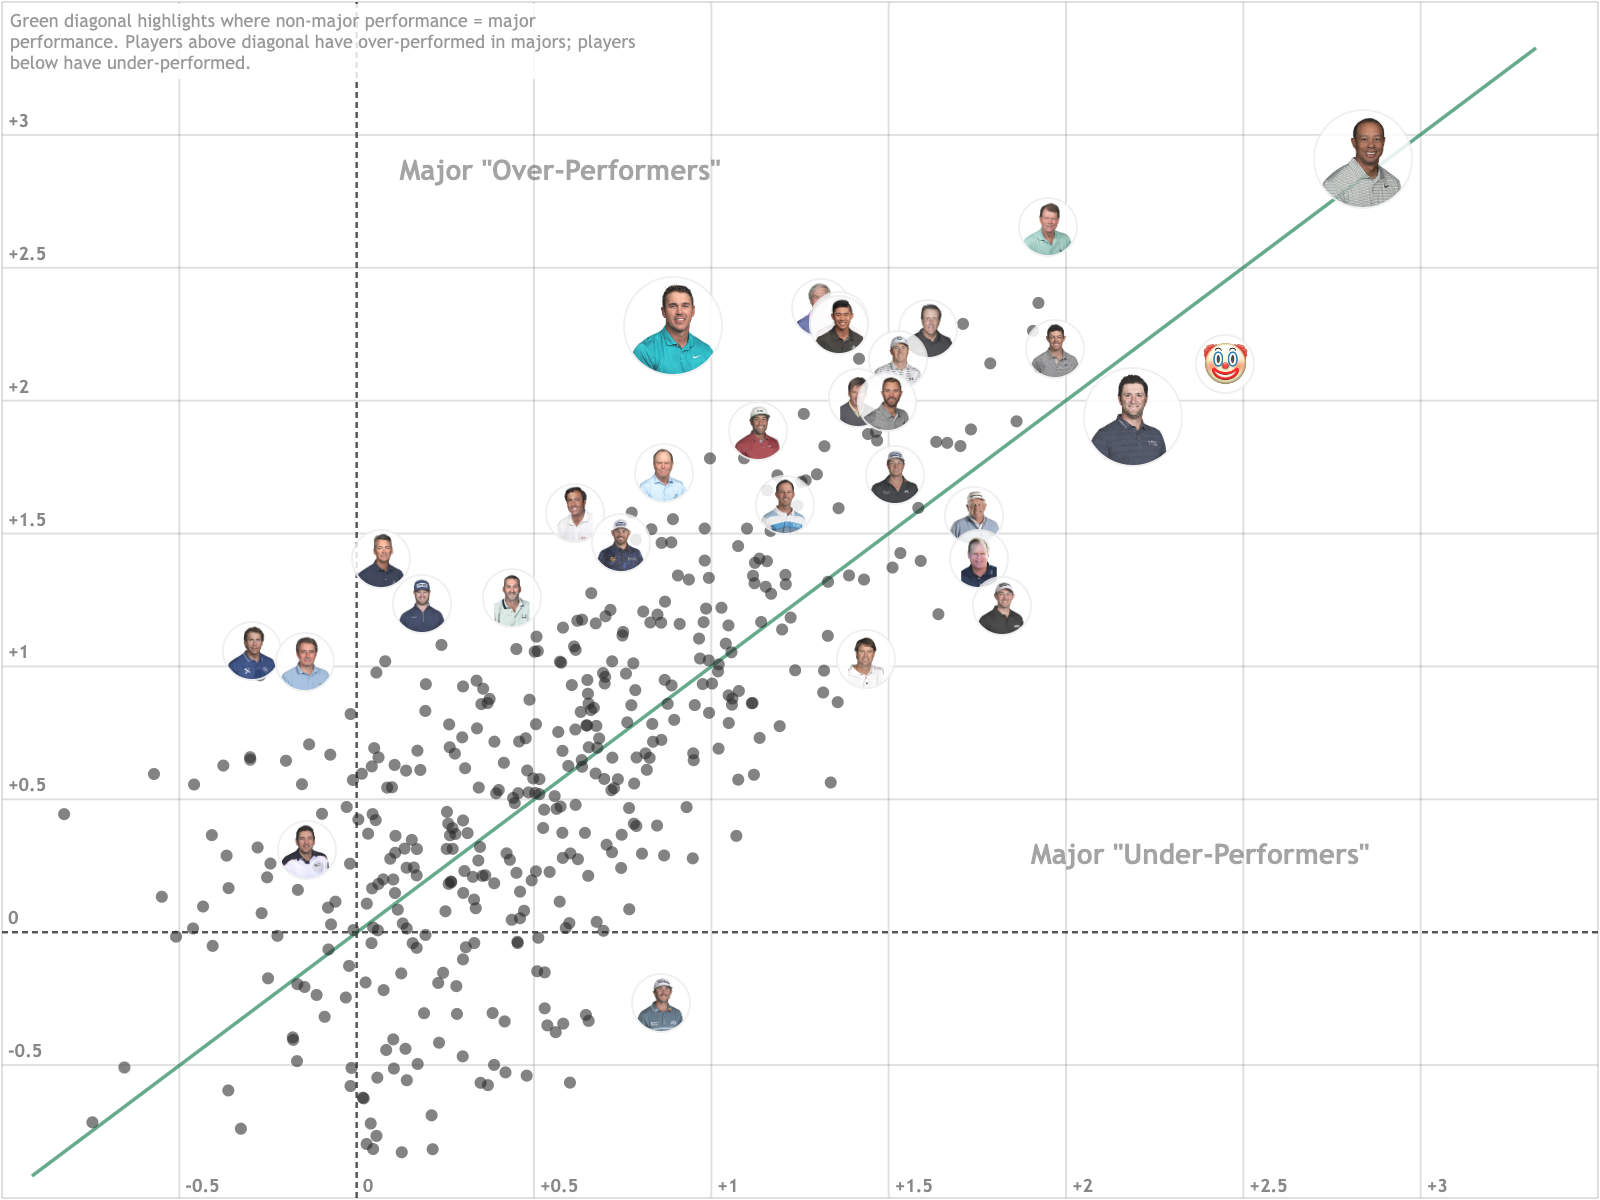
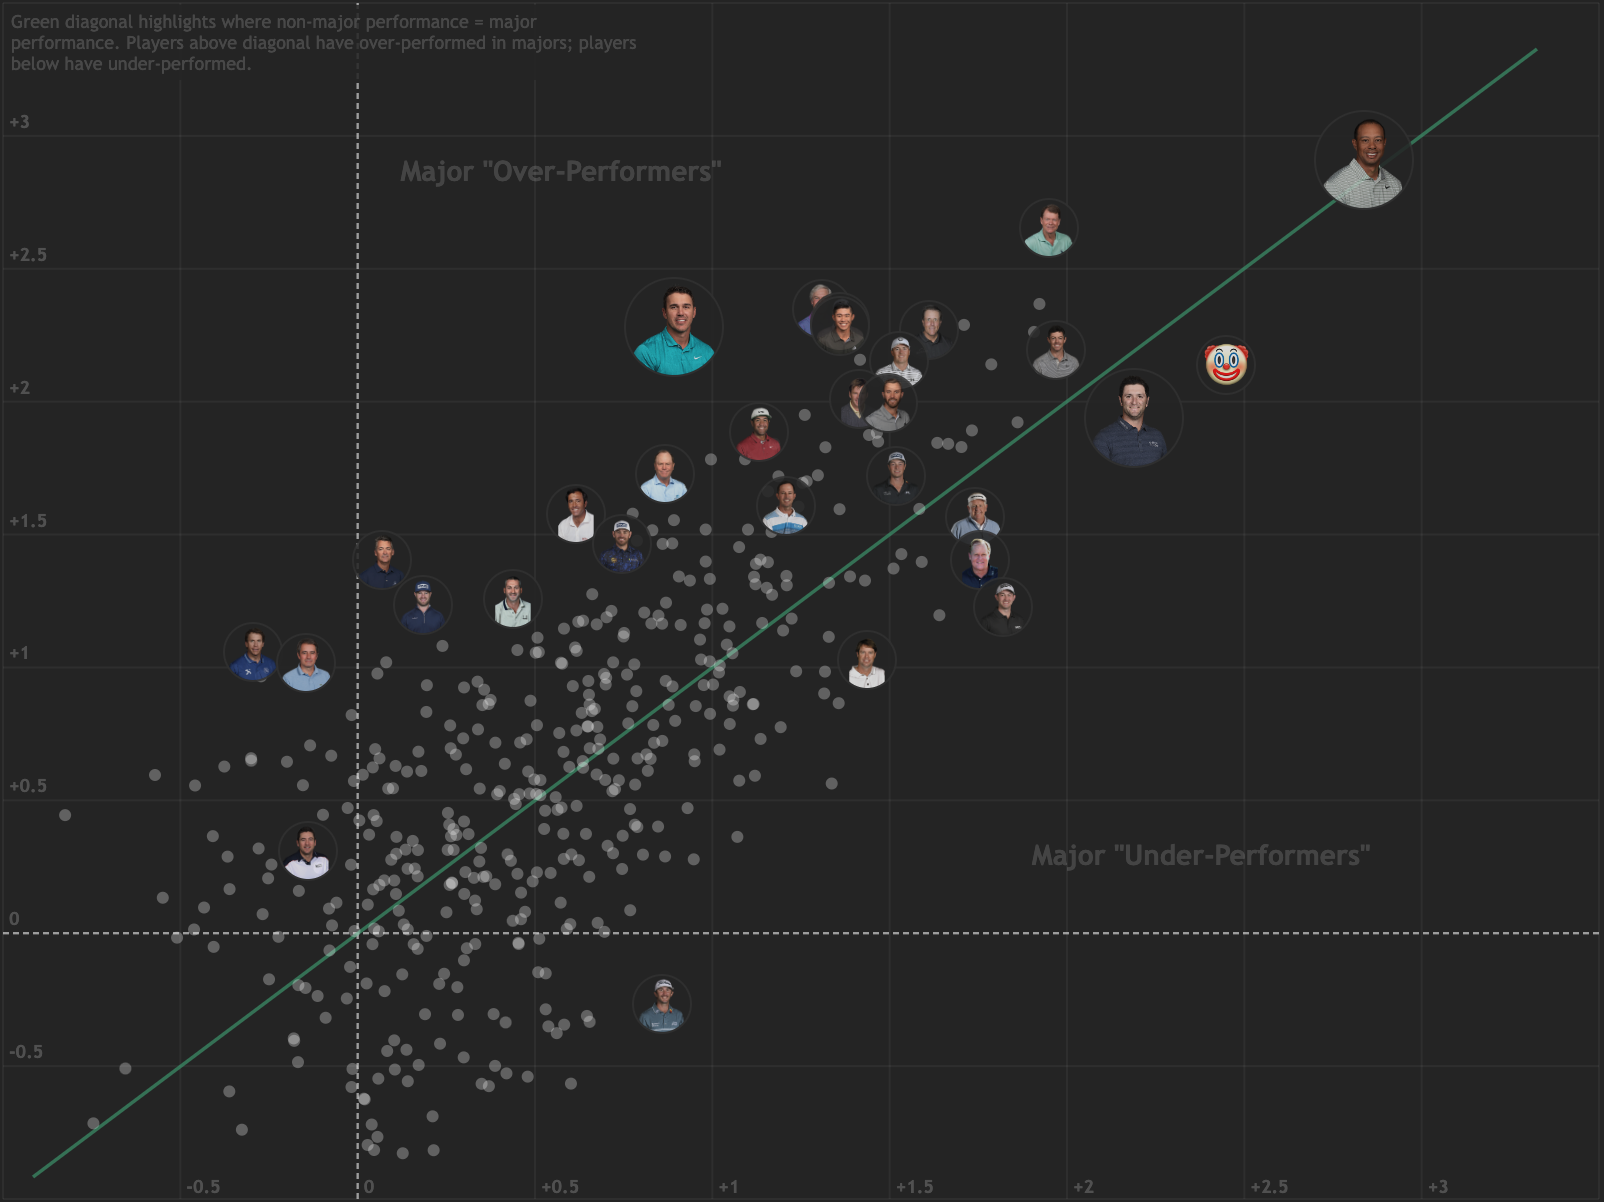
 Interestingly, the lack of “fit” hasn’t stopped Thomas from putting up strong performances in the past at this course; he’s performed 0.6 shots better per round than our model’s baseline expectation in his 18 trips around Waialae.
Which will prevail this week, history or fit?
Which will prevail this week, history or fit?
1 STROKE WORSE THAN BASELINE
Unless you’ve been living under a rock over the past few months, you’ve almost certainly noticed the solid play of Patrick Cantlay.
In fact, he ranks 11th in our trending table, gaining 1.1 strokes per round (versus an average PGA Tour player) in his last 5 starts. Pretty good, right?
No! These performances are a full stroke worse than his 12-month baseline, placing him behind only Chez Reavie for the worst baseline trend index across all tours.
1.1 TRUE EXPECTED WINS
There is a very fine line between winning and losing on the PGA Tour.
Xander Schauffele played well enough to win for 72 holes at the Sentry Tournament of Champions, but ultimately walked away from Kapalua with as much hardware as Martin Trainer.
Of course, win tallies are not the only way to measure success.
In terms of expected wins, which measures the likelihood, or expectation, of a given strokes-gained performance resulting in a win, Schauffele’s performance last week was equivalent to that of the eventual winner, Justin Thomas.
We estimate that Schauffele’s performance, as well as Thomas’ and Reed’s, would win an average PGA Tour event (this is where the ‘true’ part in ‘true expected wins’ comes from) about 18% of the time.
Looking at the 2020 season so far, Xander actually leads the PGA Tour with 1.1 true expected wins; Justin Thomas has 0.72.
2.49 STROKES PER ROUND
Despite the windy conditions last week at Kapalua, it was still a ‘low-variance’ week, with a standard deviation in ‘residual’ scores of just 2.49 strokes per round.
‘Residual’ here means the difference between our model’s prediction and the player’s actual performance (e.g. a golfer gaining 3 strokes over the field when we predicted a gain of 1 stroke is a residual score of +2).
For some context, the standard deviation in residual scores using data from all PGA Tour courses is about 2.78.
This is not a new phenomenon at Kapalua, as the course has historically yielded scores exhibiting some of the lowest variability on tour.
Why should we care about this?
Apart from the fact that it is intrinsically interesting, this is important for making probabilistic predictions.
All else equal, the lower the variance in scores the easier it is for higher-skilled players to separate themselves over 4 rounds. In other words, at low-variance courses, the win probabilities for the higher-skilled players go up.

 Data Visualization Blog